CMPT732 Group project NYC CAB Analysis
Tip Analysis
author: Yanfei
0. Motivation and Background
As I came from a non-tipping country, I am very interested in analyzing tips of NYC, so I can understand the tipping convention and know how much I should tip the cab drivers if I travel to New York. Meanwhile, analyzing tips might also reveal some interesting information about economics or city development.
My Guess for factors affecting tipping are:
- economic situation: maybe after 2020, passengers will tip less due to the economic recession caused by covid, so time features like year, month, will be useful;
- passenger’s income: can be reflected by the pick-up/drop-off location.If the trip ends at financial districts, we might assume the passenger are wealthy and tip more;
- passenger’s satisfaction to the trip: a matter of course, but it seems we cannot find sufficient information from our dataset to demonstrate this;
For this project, I will first do ETL to filter unwanted data and extract useful features, then do some general analysis about the relationship between tipping and other features, finally try if I can construct a model to predict the tip of a trip.
1. ETL
1.1. Initial ETL
Please check home page for the intial ETL
1.2. Further ETL for Tips
- payment_type = 1, only trips pay by credit card has their tip amount recorded in the dataset.
-
Tip Ratio/Percentage is calculated by
tip_amount/(total_amount - tip_amount). Percentage will be used for subsequent visualization. -
Tip Range: Based on the distribution of tip ratio, we further assign the tip to several ranges to help analyze the massive data. The tip range is calculated by
ceil(20*tip_amount/(total_amount - tip_amount)), below is the table of range index and corresponding range:tip_range_index indicated range 0 tip=0 i between 1 and 8 tip > 5i, <= 5i + 5 9 tip > 40 - fare_amount BETWEEN 2.5 + (2.5 ± 0.5) * trip_distance: According NY cab official guide, the fare should be $2.5 initial charge plus 50 cents per 1/5 mile when traveling above 12mph or per 60 seconds in slow traffic or when the vehicle is stopped. Here I increase the range to allow some deviation.
- Fare amount: for tip prediction.
- Other Amount: is calculated by
total_amount-tip_amount-fare_amount. Includes all other fares such as tolls. Should be useful for tip prediction. - Date, Year, Month of pickup: for analyzing tip changes over time. Is generated by the sql built-in functions.
- Pickup/Dropdown location: can somehow reflect the income level of passengers.
After ETL, we have 114,348,011 records to analysis.
2. General Analysis
2.1. How do NYC passengers tip?
2.1.1. A Full View of Tip Distribution
According to New York Official Guide, the tipping to cab driver should be 15–20 percent of total fare, which is confirmed by our result.
2.1.2. What is the Average Tip from 2017 to 2021?
| year | mean_tip_percent |
|---|---|
| 2017 | 18.752909945721235 |
| 2018 | 18.636400564789707 |
| 2019 | 18.146659574580887 |
| 2020 | 18.43724157920186 |
| 2021 | 18.73994173994071 |
2.1.3. Crazy Tippers
Some trips have extremely huge tips that can go up to hundreds of dollars. The largest tip of our filtered record is 1001 dollar, from a trip in the early morning on 2020-07-02.
| pickup_datetime | 2020-07-02 05:50:12 |
| dropoff_datetime | 2020-07-02 05:55:46 |
| from | UN/Turtle Bay South, Manhattan |
| to | Gramercy, Manhattan |
| fare_amount | 6.5 |
| tip_amount | 1001.0 |
| total_amount | 1010.8 |
At first I thought this is a failure in car recorders, but similar stories have been reported. Check the articles crazy-taxi-stories-and-data-from-new-york-city and philly-cab-driver-gets-1000-tip.
Daily Max Tip From 2017 to 2021
2.2 Has Covid changed how passengers tip?
At first, I thought the economic downturn caused by covid would lead to decrease in tipping, but the tip distribution barcharts overturned my guess as the tip distribution remained although the trip amount decrease significantly in 2020. The daily mean tip heatmap below shows more detail. The mean tip decreased in February 2019, and rebounded in March 2020, and the mean vary from 17 to 21%, not a significant difference. So may be the economic recession only affects on the trip amount. The poor no longer call a taxi, while the rich keep their tipping behavior.
Also notice that the mean is relatively higher from March to June 2020, the lockdown period of NY. So we might infer that the difficulty of travel lead passengers to tip more considering the hard work of the drivers.
2.3. Does tipping vary by location?
2.3.1. Yellow VS Green
You might have noticed that in the previous distribution barcharts, the green cab passengers tend to tip less than those yellow. In 2021, Quite a few green cab passengers do not even tip. In New York, yellow cabs run mainly in the busy commercial areas of Manhattan, while green cabs, introduced in 2011, run in areas not served by yellow cabs. This give us a new question, do tipping vary by the pick-up/drop-off locations?

2.3.2. Mean Tip Percent by Locations
The answer is yes. We consider a trip occurs at a location if it is the pick up location or drop off location, then do a bunch of join quries to get the mean tip ratio by location. The heatmap below shows the mean tip ratio of each location in New York. Red areas have higher tip_ratio while blue areas have lower.
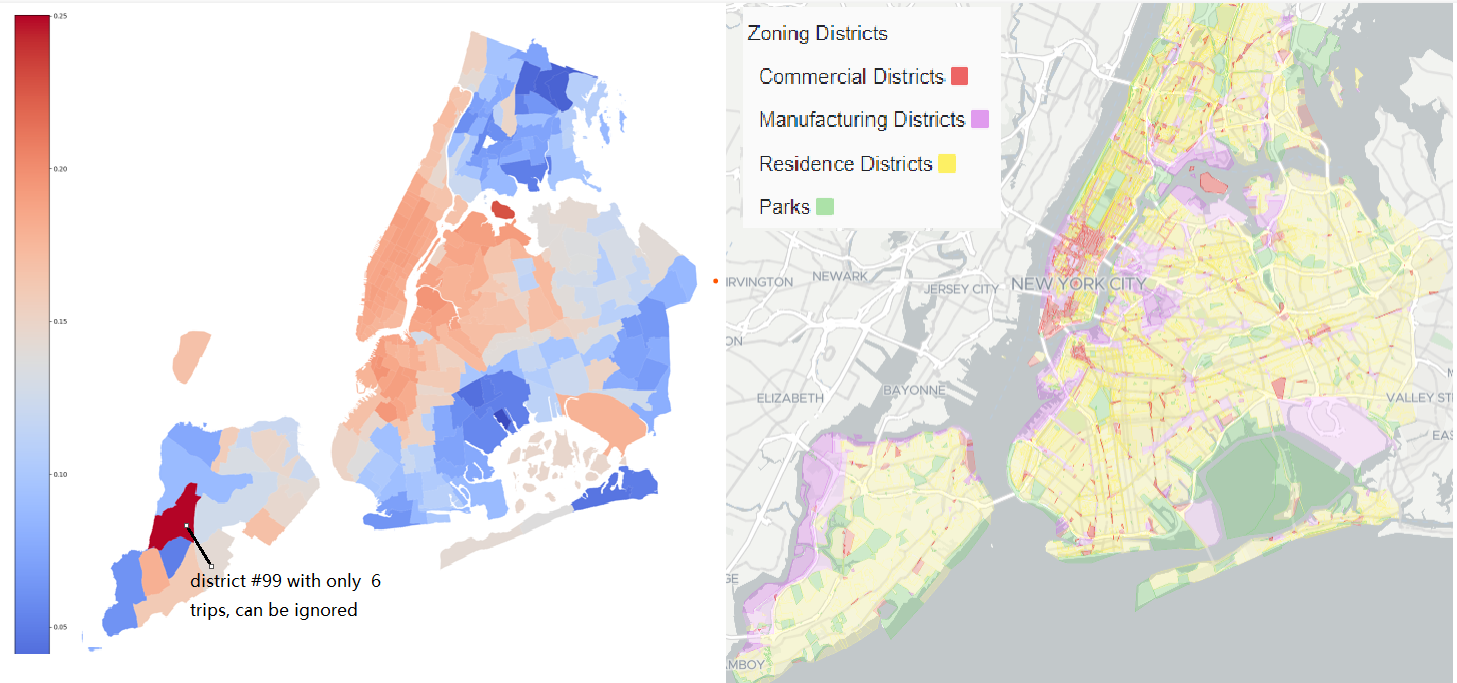 We can see the business zone, e.g. Manhanttan, North Queens, have relatively high tipping with red color, while remote resident areas and parks in the south have low mean percent colored in blue. Notice that the red area in the south east is the JFK Airport. Check the New York City’s Zoning & Land Use Map.
3. Predicting Tips
The cab driver may want to know how much he can get for the tip based on the time, location, etc. So let’s try to construct models and see if we can predict the tips.
3.1. Further Feature Engineering
- tip/total ratio <= 0.4: our target for regression models.
- tip range: divided to 4 intervals, =0, 0 - 10, 10-20, >20, our target for classifier models.
3.2. Model Performance
Regressors
| model | Evaluation Score | TOP 2 important features |
|---|---|---|
| DecisionTree | r2 = 0.0427 rmse = 6.5653 |
other_amount: 0.8204, fare_amount:0.1748 |
| RandomForest | r2 = 0.0474 rmse = 6.5468 |
other_amount: 0.2284, fare_amount: 0.1713 |
| Gradient Boosted Tree | r2 = 0.0427 rmse = 6.5653 |
other_amount: 0.8204, fare_amount:0.3296 |
Classifiers
| model | Evaluation Score | TOP 2 important features |
|---|---|---|
| DecisionTree | accuracy=0.5417 | other_amount: 0.5913, fare_amount: 0.2621 |
| RandomForest | accuracy=0.5224 | other_amount: 0.6657, fare_amount: 0.3144 |
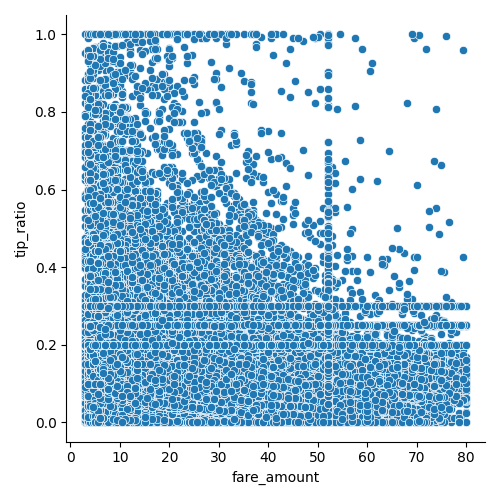
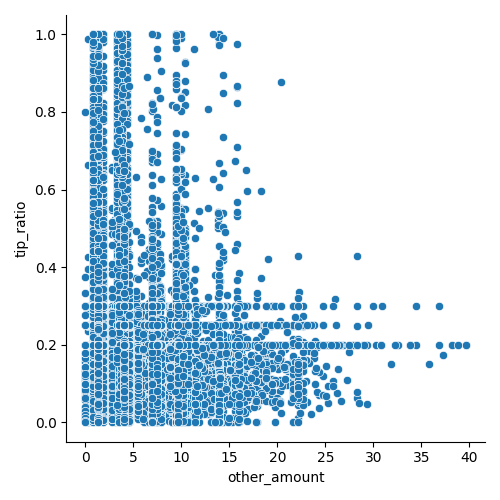
I tried several models provided by pyspark, and neither the regression nor the classification models performed well. It seems we do not have sufficient data to perform tip prediction. However, all models agree that fares and other amount have the greatest importance on deciding tips, which we do not consider previously. After ploting the data, we can see that some passengers tip quite generously on small amount trip.
4. Conclusion
- The average tipping percent of New York cabs is about 18% of the total fare.
- Most passengers tip 15% to 20% of the total amount.
- Covid does not lead passengers to tip less. In contrast, during the lockdown period, passengers tip more consider the hard work for difficult trips.
- Yellow cab passengers tip more than green cabs passenger.
- Passengers travel to commercially dense areas in the north tip more than those to resident areas and parks in the south.
- Passengers tends to tip generously on small amount.