CMPT732 Group project NYC CAB Analysis
Time Analysis
author: Yuchen
1. Time Subject ETL
-
Generate New Fields
-
pickup_datetime
Rename the column of lpep_pickup_datetime in the original green taxi datasets and tpep_pickup_datetime in the original yellow taxi datasets because of the difference in naming style.
-
dropoff_datetime
Rename the column of lpep_dropoff_datetime in the original green taxi datasets and tpep_dropoff_datetime in the original yellow taxi datasets because of the difference in naming style.
-
year
The year column is generated by extracting the pickup_datetime column.
-
month
The month column is generated by extracting the pickup_datetime column.
-
monthday
The monthday column is generated by extracting the pickup_datetime column.
-
weekday
The weekday column is generated by extracting the pickup_datetime column.
-
date
The date column is generated by extracting the pickup_datetime column.
-
duration
The duration column is generated by the pickup and dropoff time difference in seconds.
-
speed
The speed column is generated by trip distance divided by duration.
-
-
Keep Only the Records We Care About
- Delete records with a year less than 2017 or greater than 2021.
- Delete records with a total amount less than or equal to 2.5.
- Delete records with LocationID = 264 or 265, which indicates an unknown location.
- Delete records with a duration less than 0min and greater than or equal to 100min because a primary duration range between 0 and 100min is observed.
- Delete records with speeds less than or equal to 0 and greater than or equal to 100km/h because the speed limit in NYC is 55mph (approximately 88.51km/h).
-
Keep Only the Columns Related to Our Analysis
- Drop all the columns other than pickup_datetime, dropoff_datetime, year, month, monthday, weekday, and date.
2. When is the period of high demand for taxis?
Perspective: If I were the taxi regulator/planner in New York City, I would want to know how the number of taxi orders changes over time because it reflects the demand for taxis from New Yorkers. It would be nice to discover certain specific patterns because it would make it easier for me to schedule taxis on the road to ensure smooth travel for citizens.
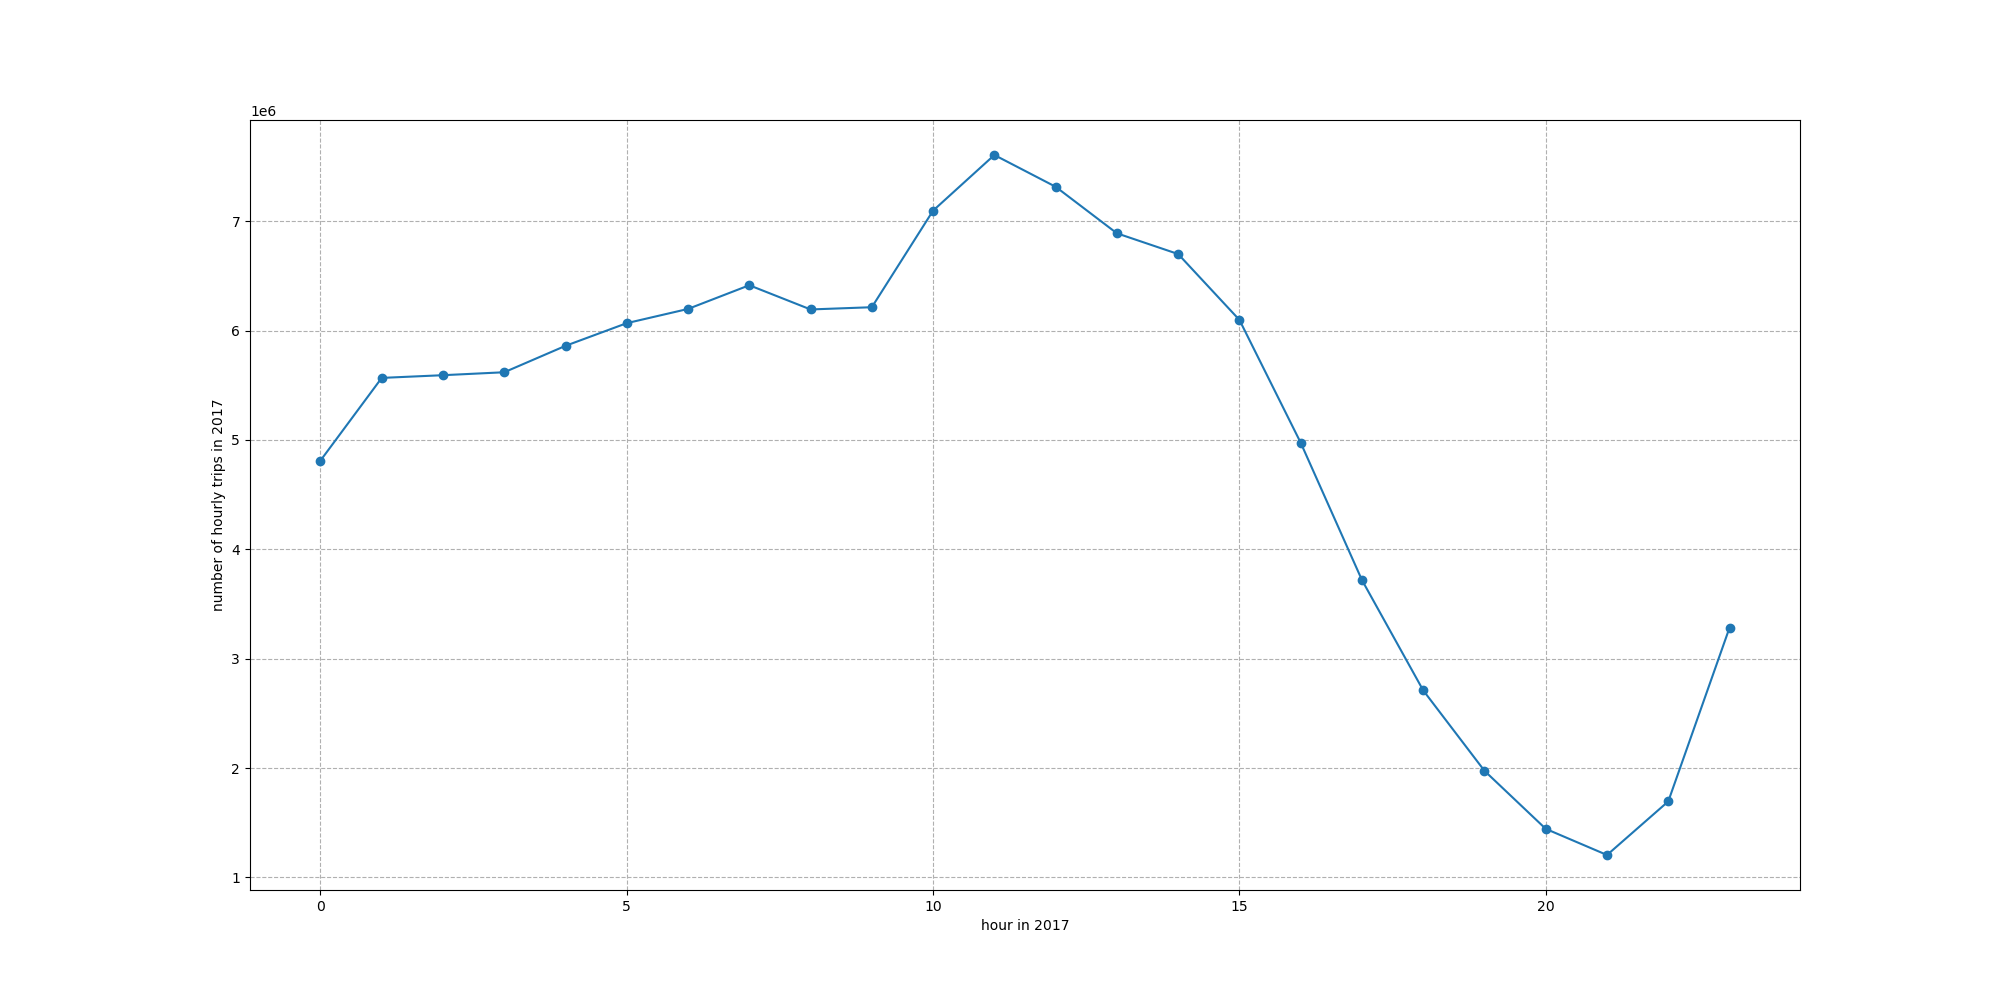
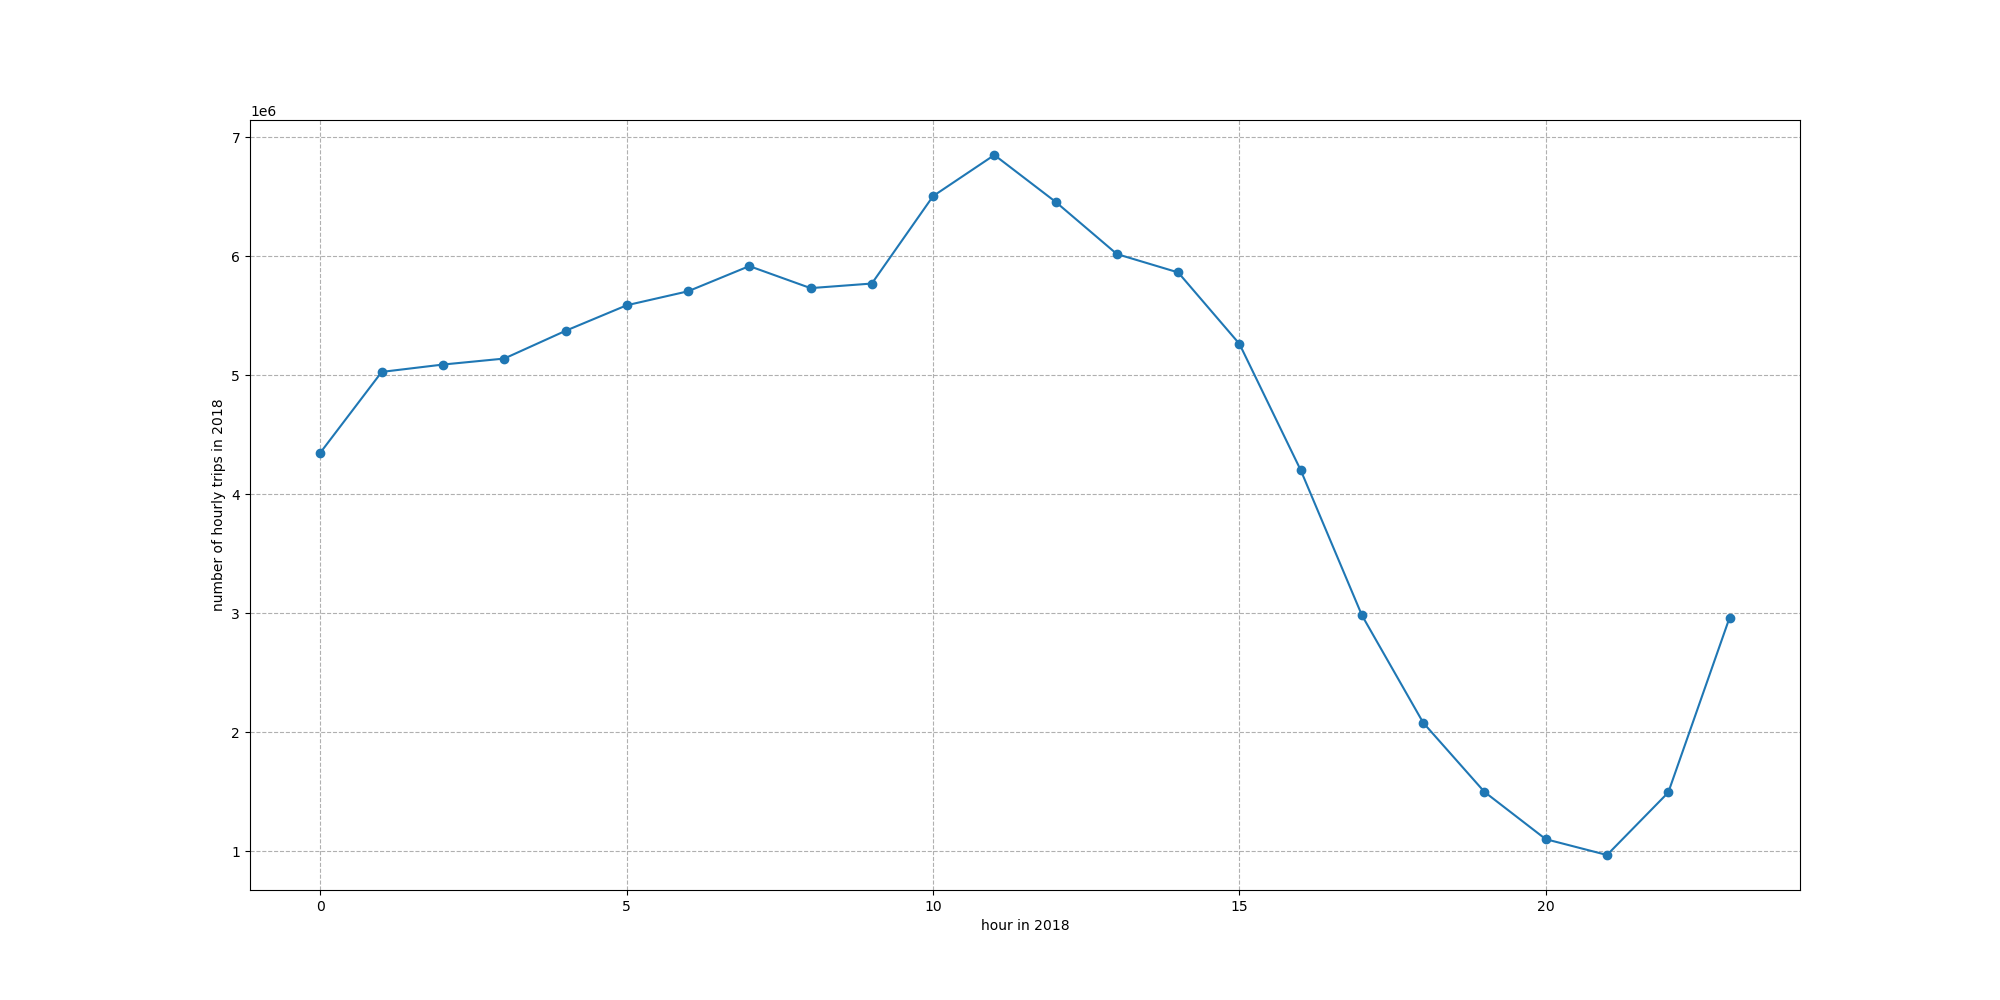
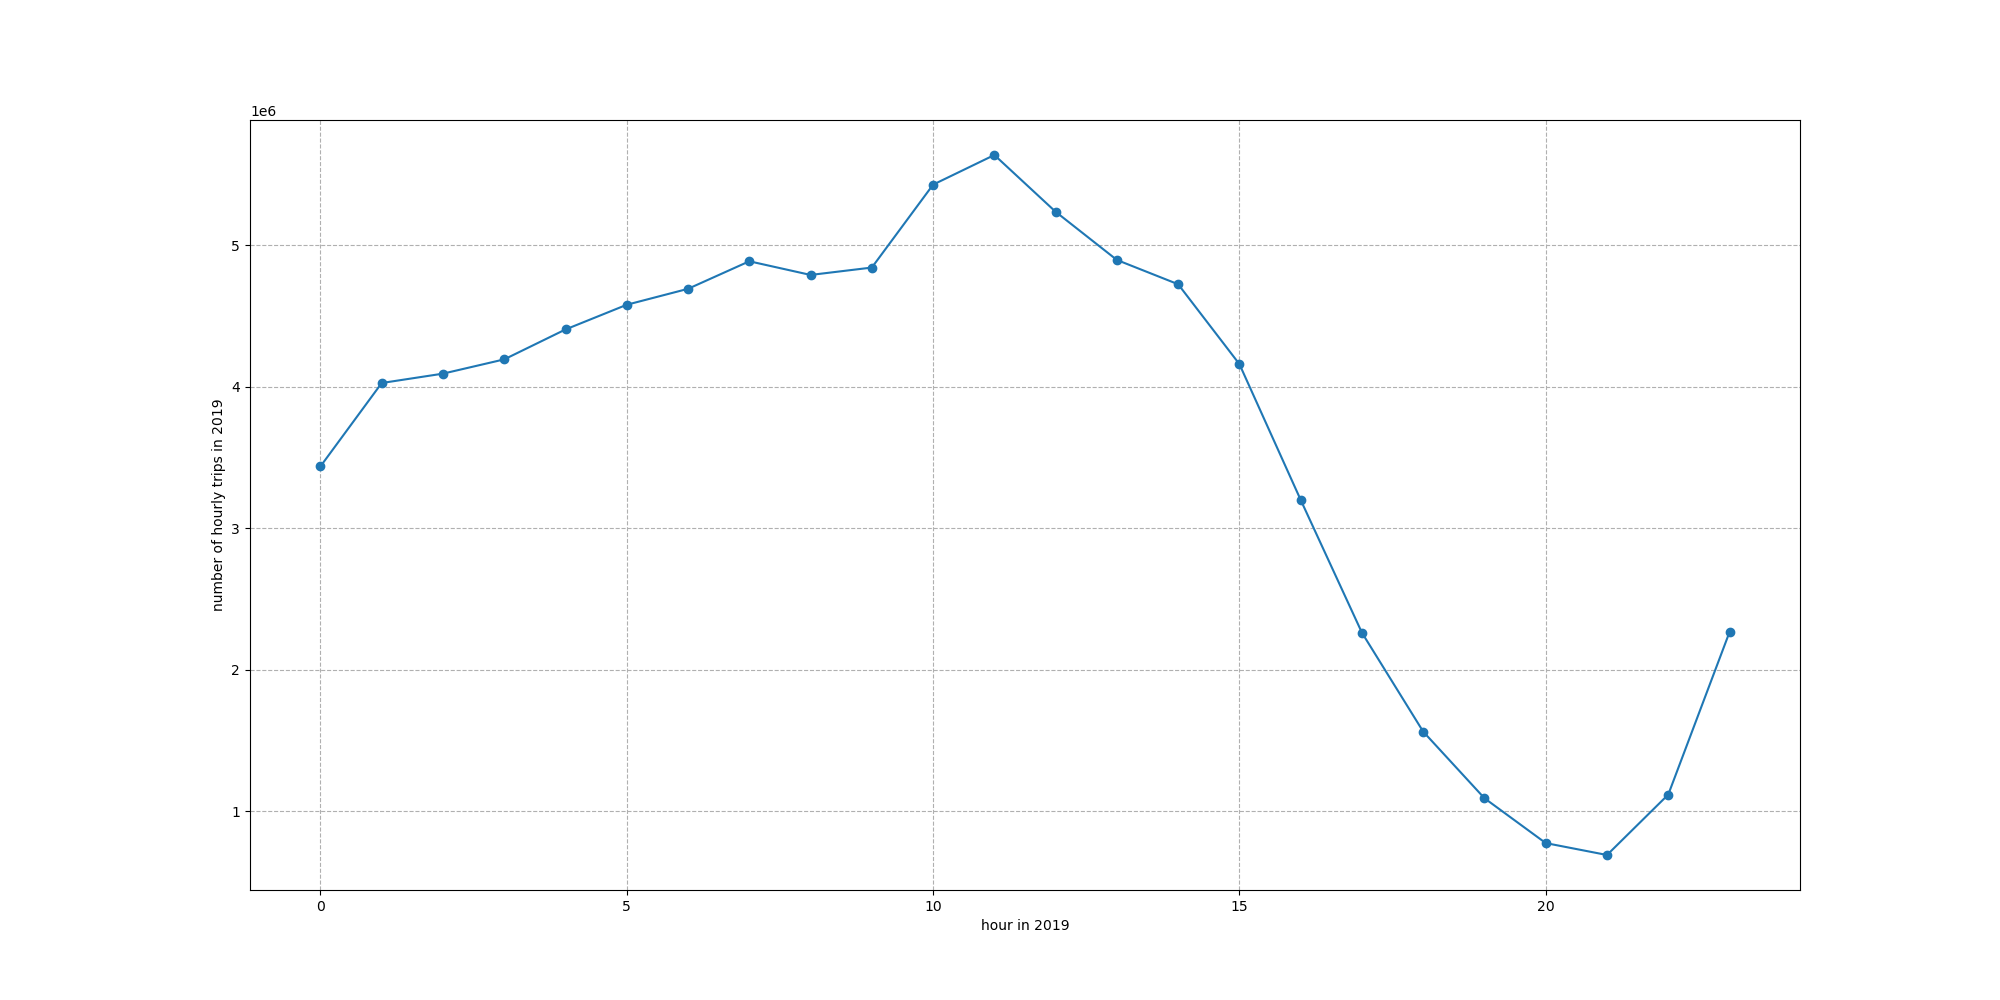
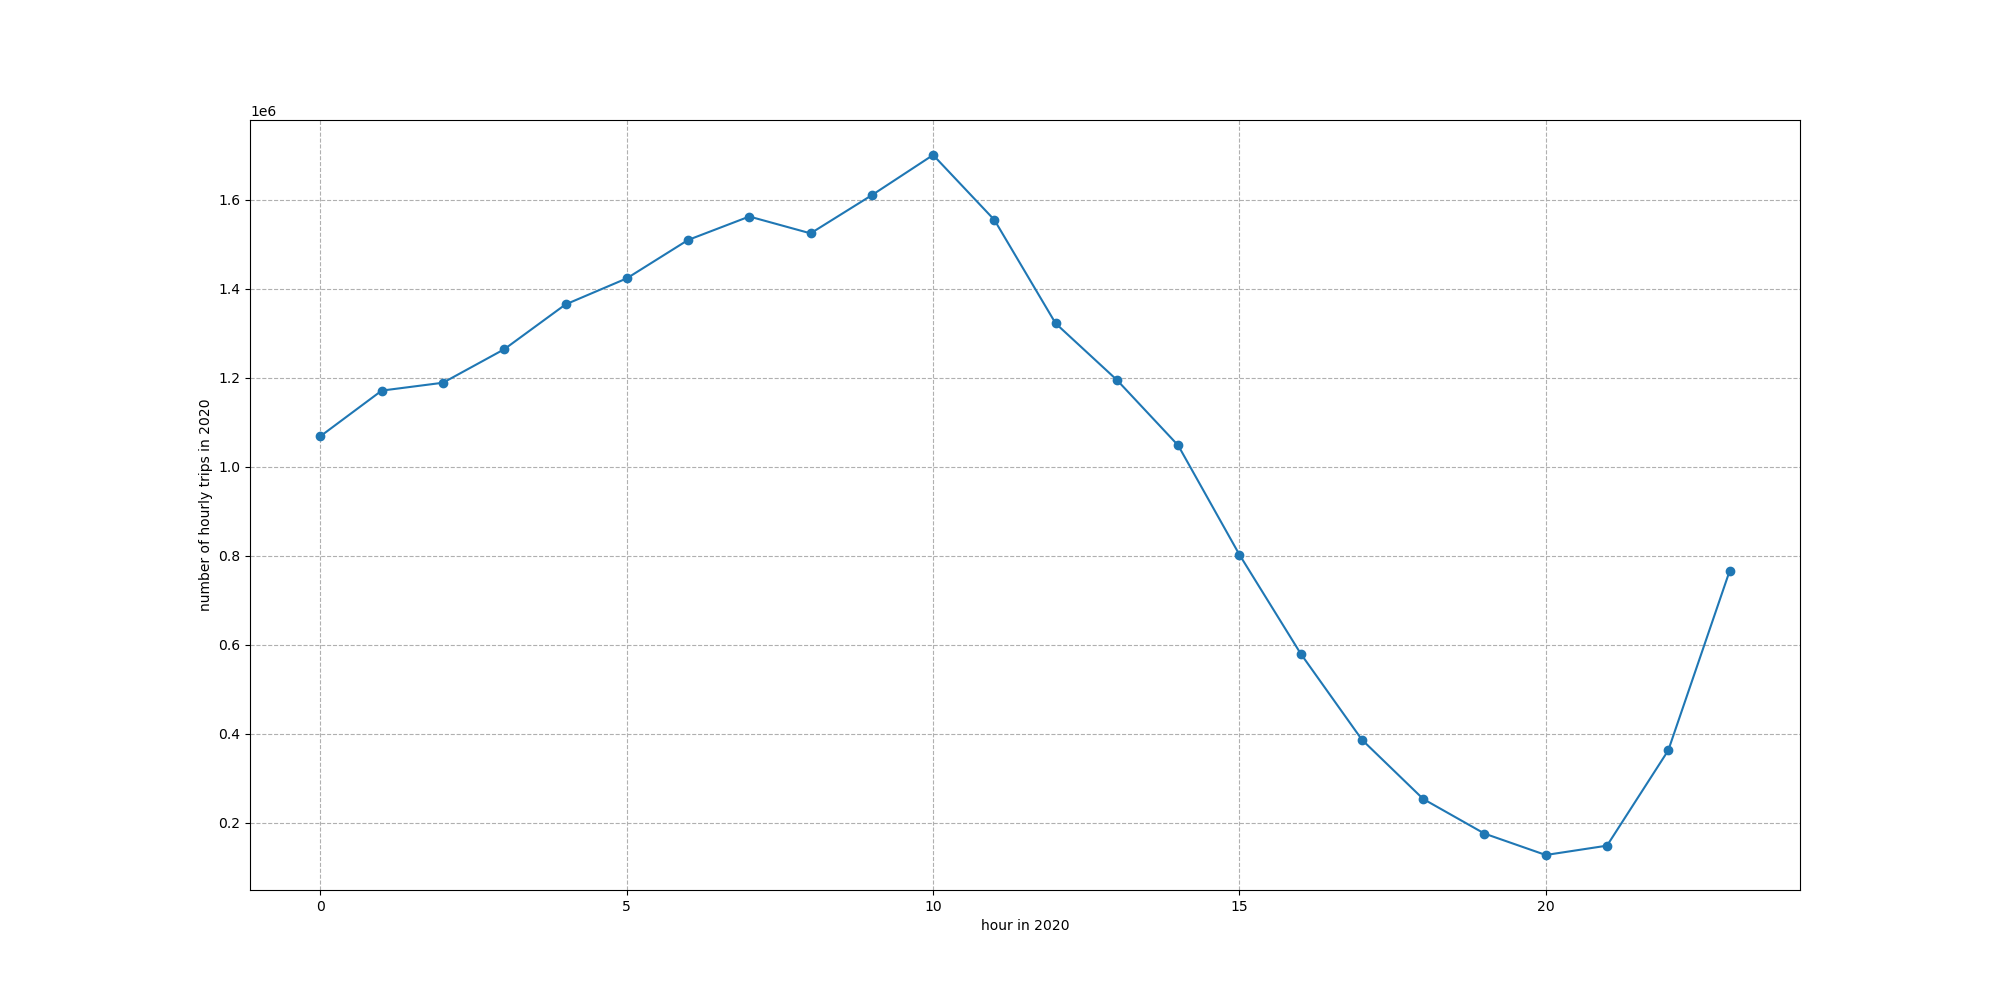
Hourly order numbers in 2017-2021
-
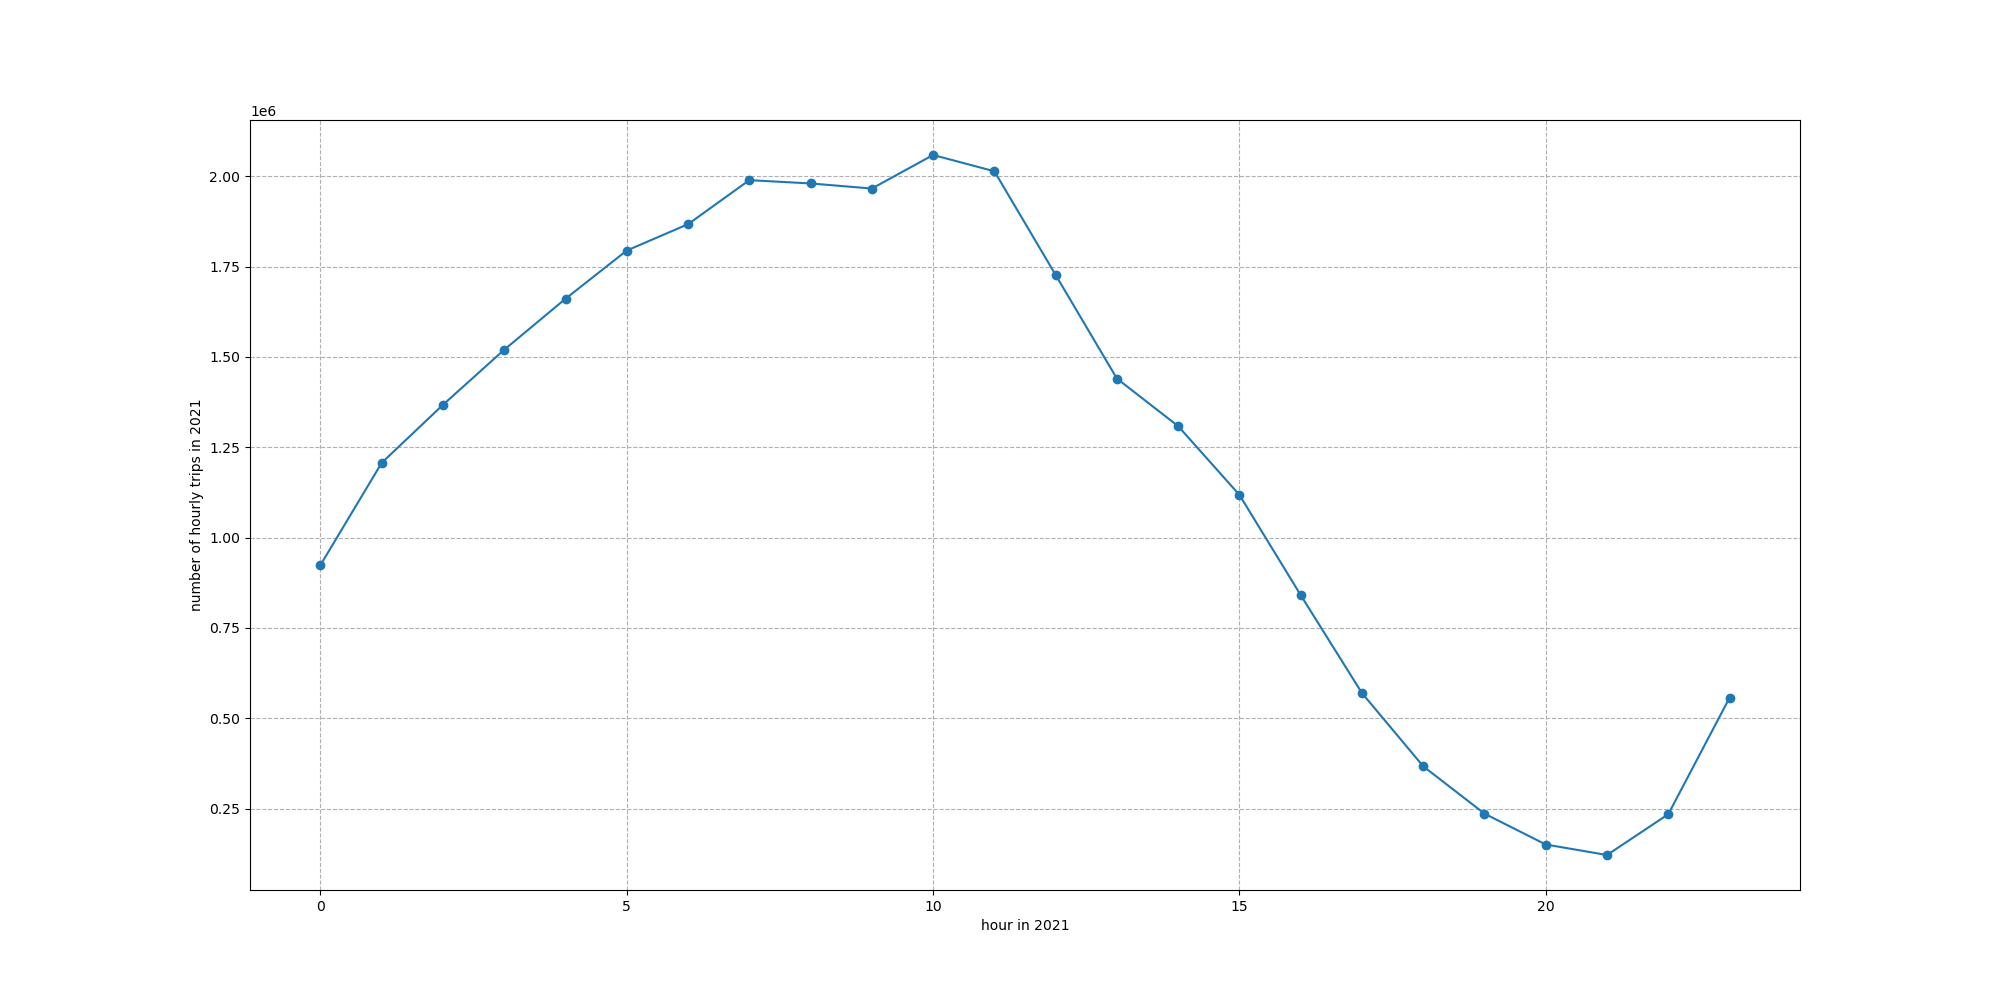
Question: How does the number of taxi orders vary by the hour?
-
Analysis: From the five graphs above, we can see the trend in the number of hourly orders is pretty consistent.
- The performance of the morning peak hours is not significant. For example, the change was insignificant from 5:00 am to 10:00 am, although the number of orders was generally on the rise. The reasons for this are:
- The travel demand of the public to work is shared by public transportation and private cars, and they prefer to avoid traveling by taxi.
- The public’s working hours are not concentrated.
-From 3:00 pm to 8:00 pm, the number of orders decreased without fluctuating, which may result from road congestion, and New Yorkers want to avoid taking taxis.
- Starting from 8:00 pm, the number of taxi orders picked up from the bottom indicates New Yorkers have a rich nightlife.
- The performance of the morning peak hours is not significant. For example, the change was insignificant from 5:00 am to 10:00 am, although the number of orders was generally on the rise. The reasons for this are:
-
Conclusion:
- New Yorkers have the highest taxi demand from 5:00 am to 2:00 pm.
- New Yorkers have the lowest taxi demand from 7:00 pm to 10:00 pm.
Daily order numbers in 2017-2021
-
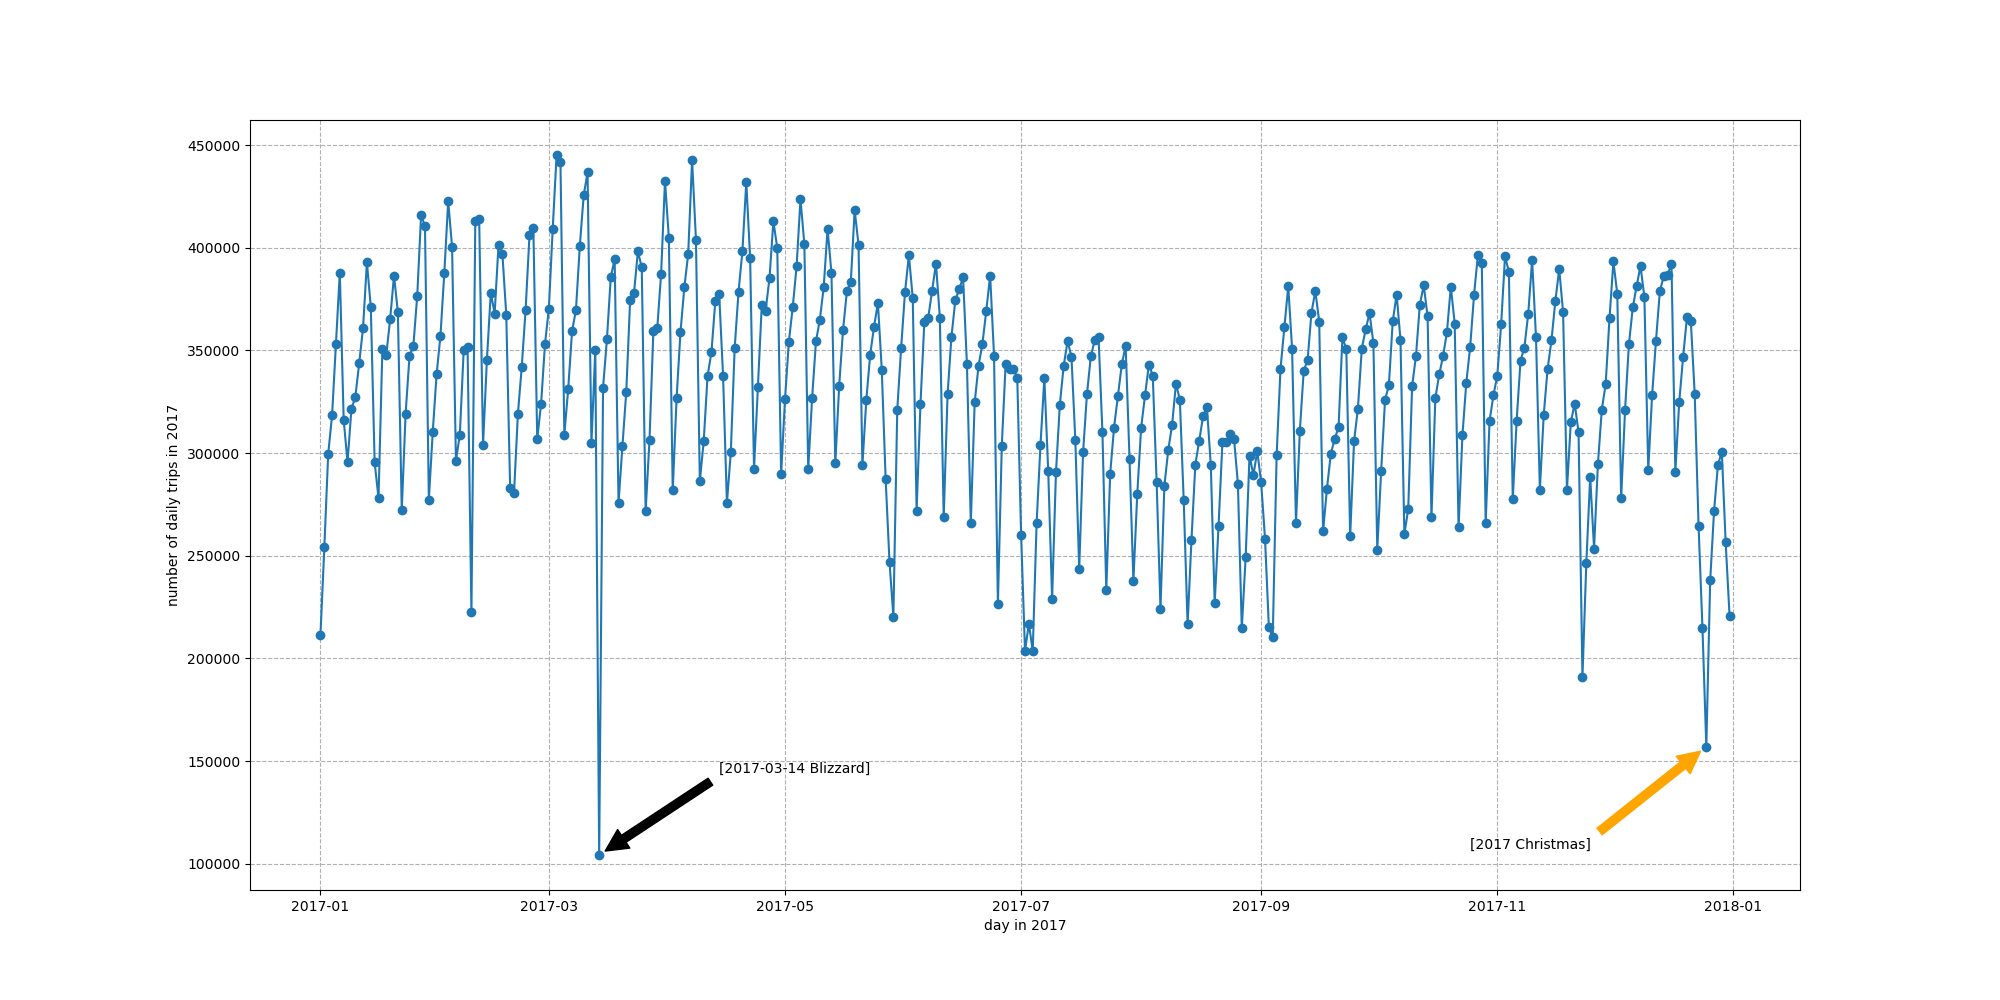
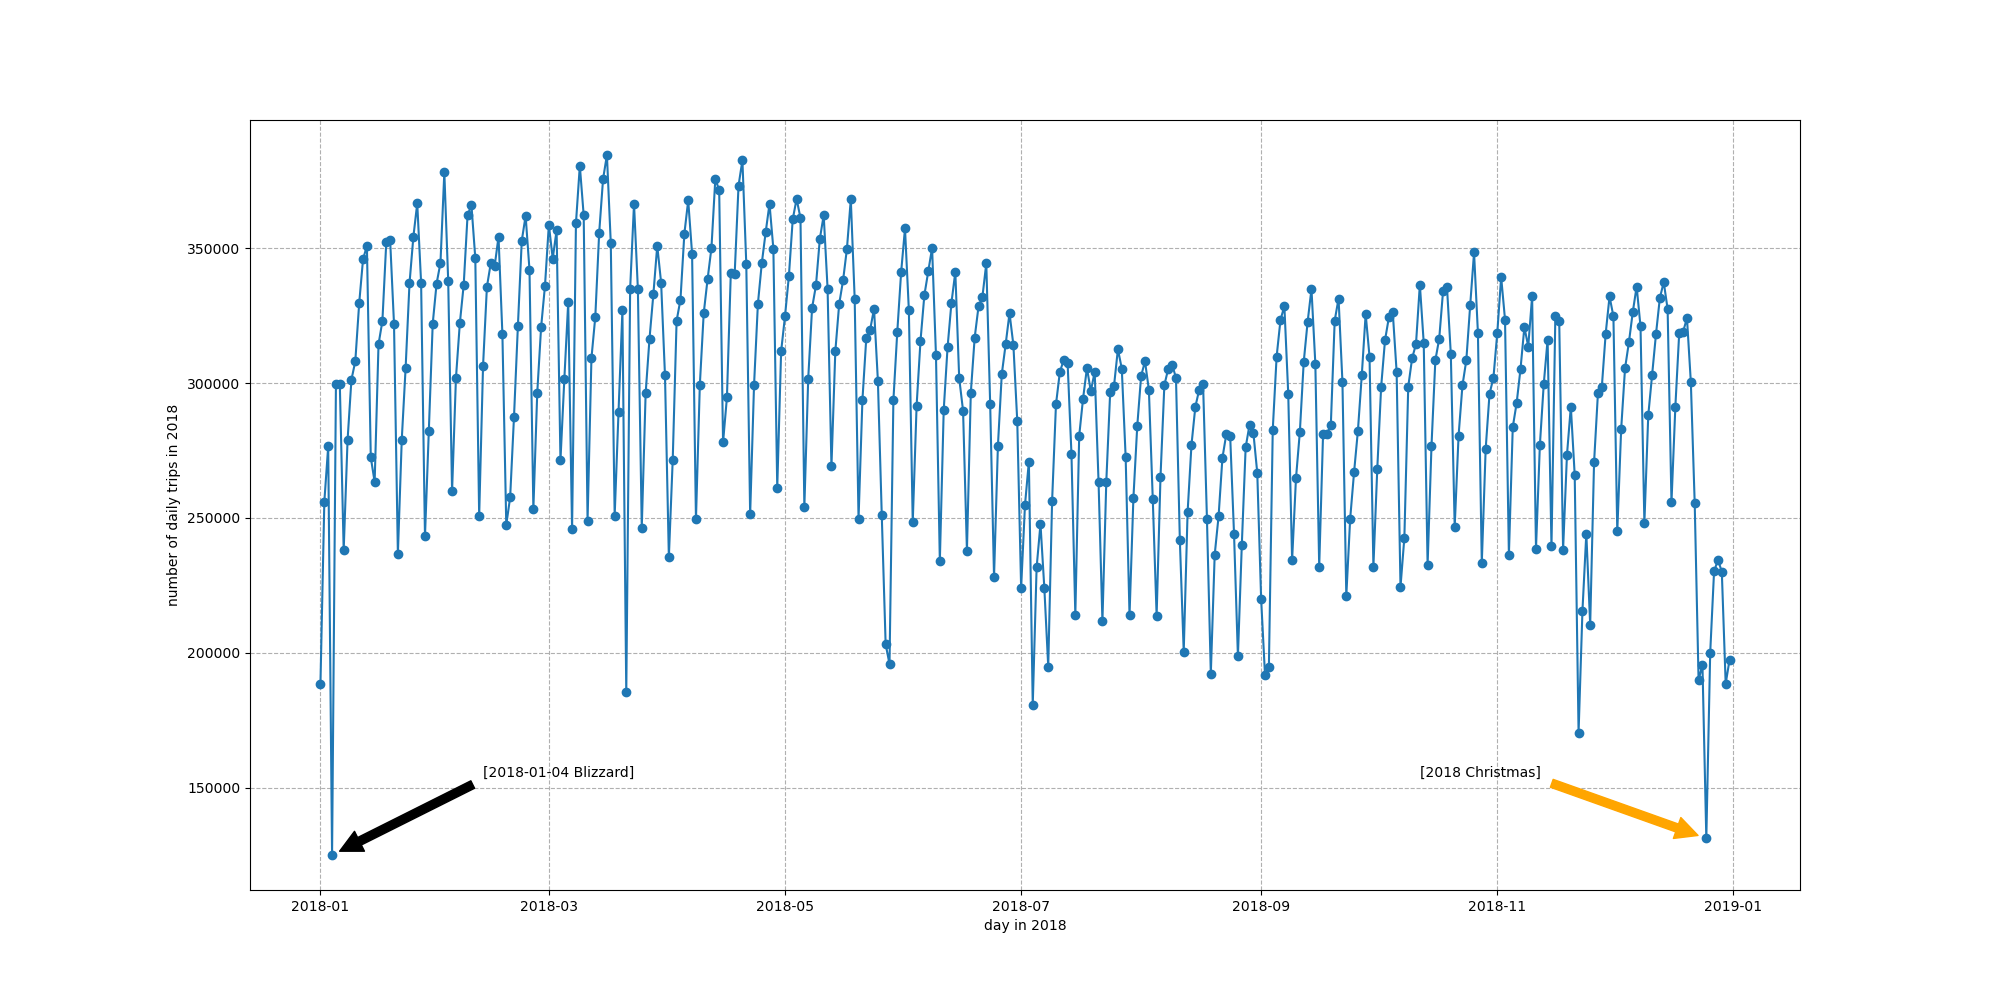
Question: How does the number of taxi orders vary daily?
-
Analysis: By counting the total daily number of orders from 2017 to 2021 and plotting the data to folded line graphs, it is clear to see some patterns.
-
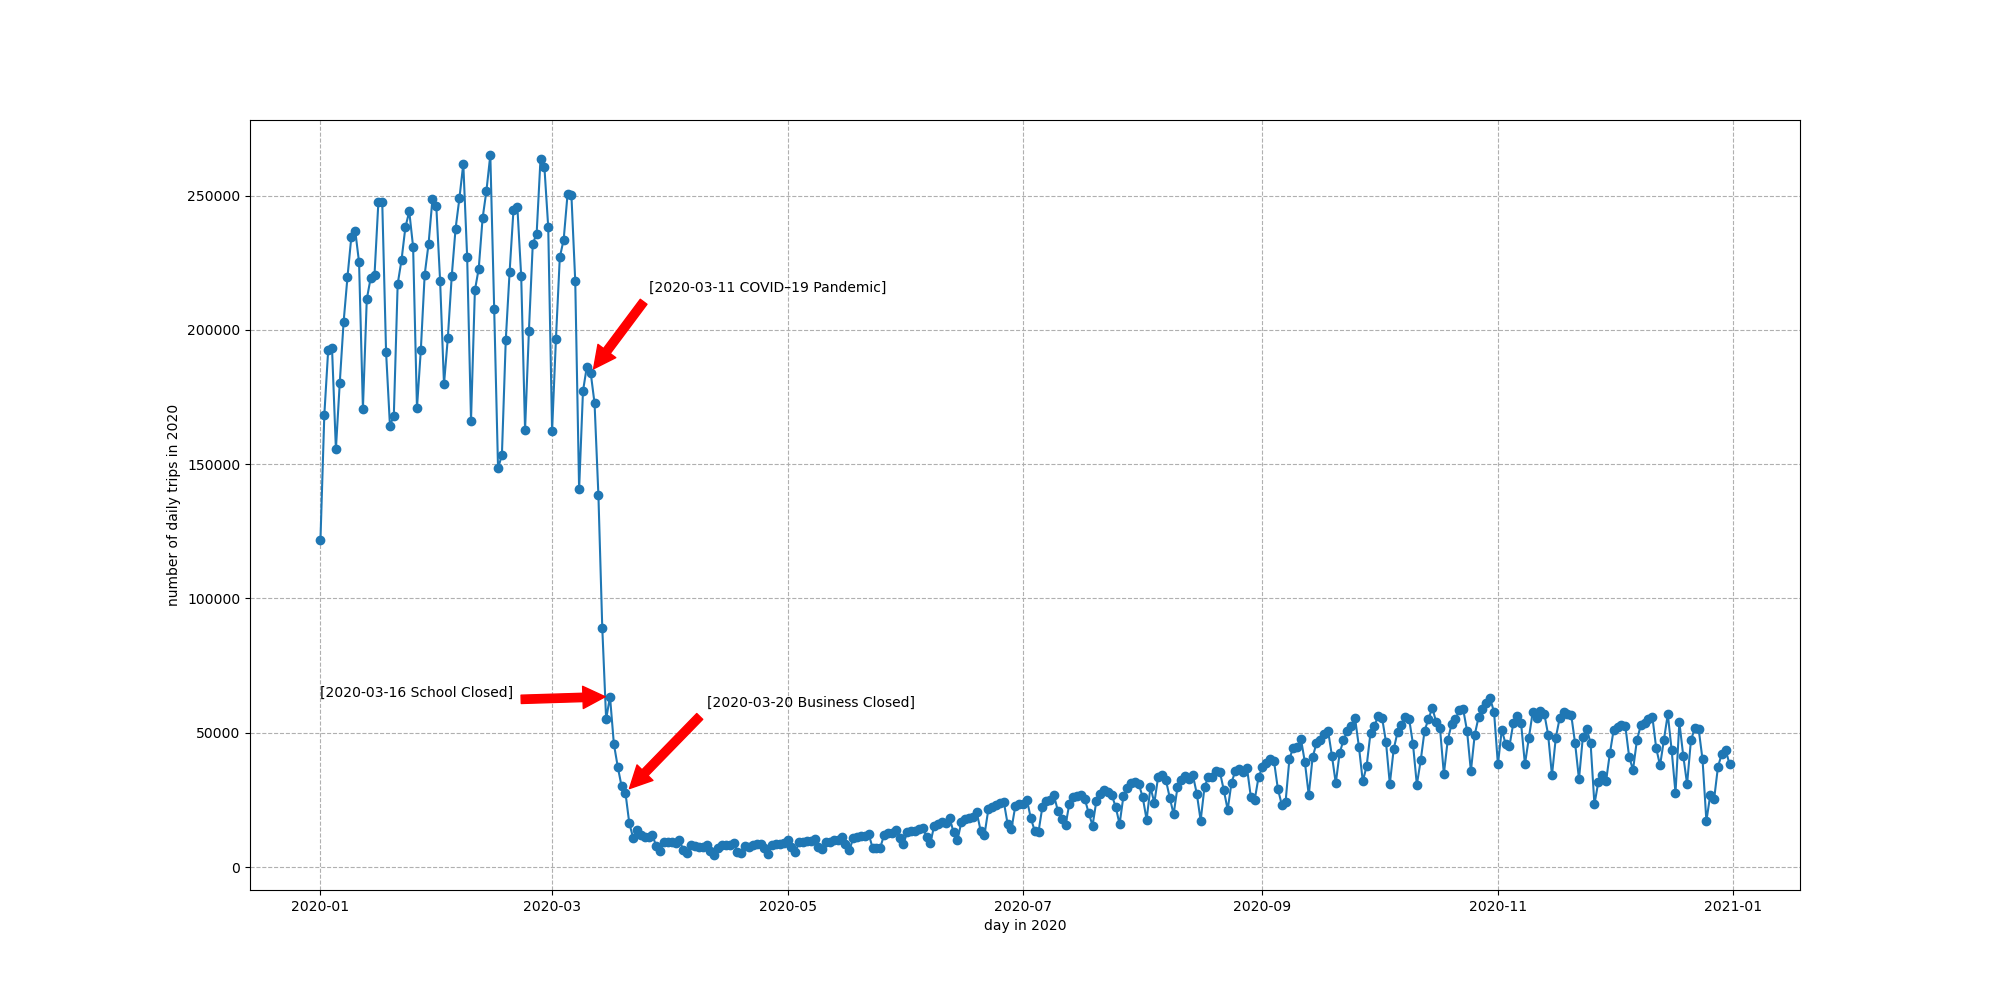
Before and after the Covid-19 pandemic, a few abnormally low values (outliers) each year needed to be investigated for their causes.
-
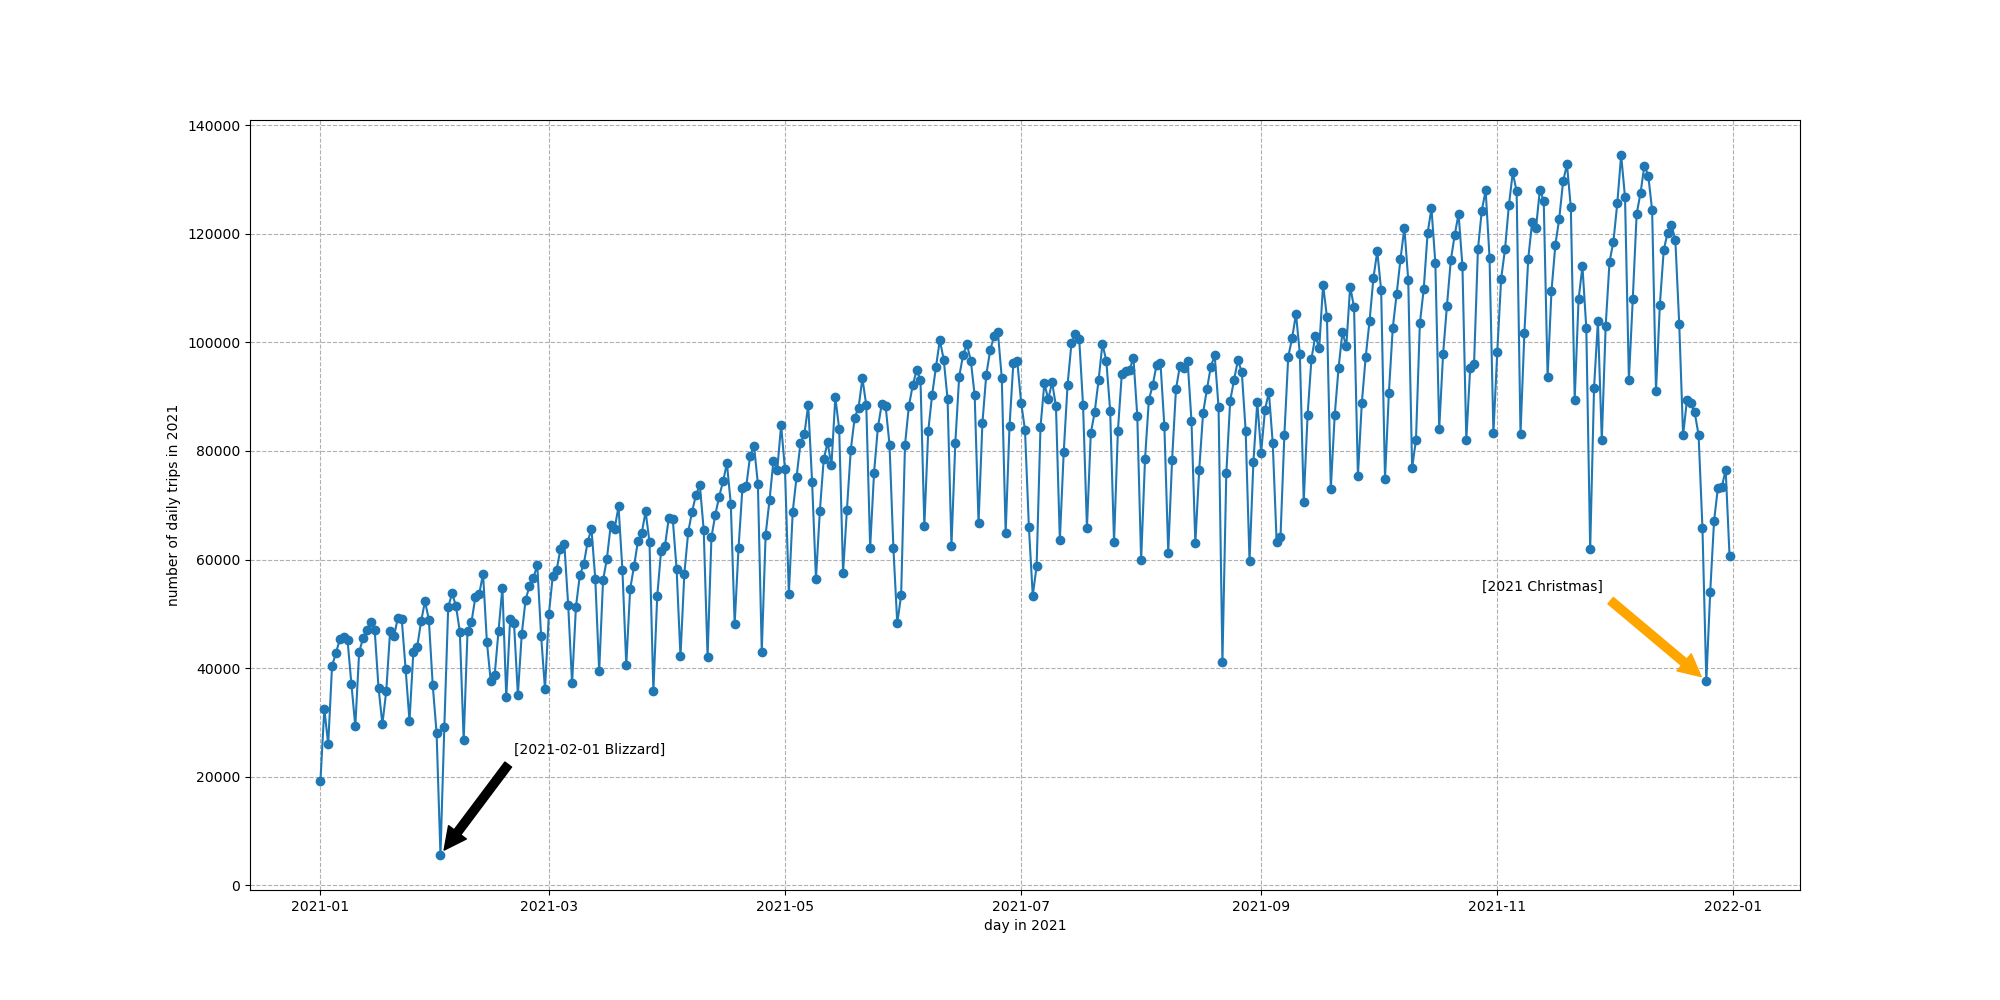
By reviewing national weather reports and news reports, it was found that snowstorms hit New York City on all these days, which have been marked with black arrows in the graphs. Because of the extreme weather, New Yorkers will not go outside. Blizzard on 2017-03-14, Blizzard on 2018-01-04, Blizzard on 2021-02-01
-
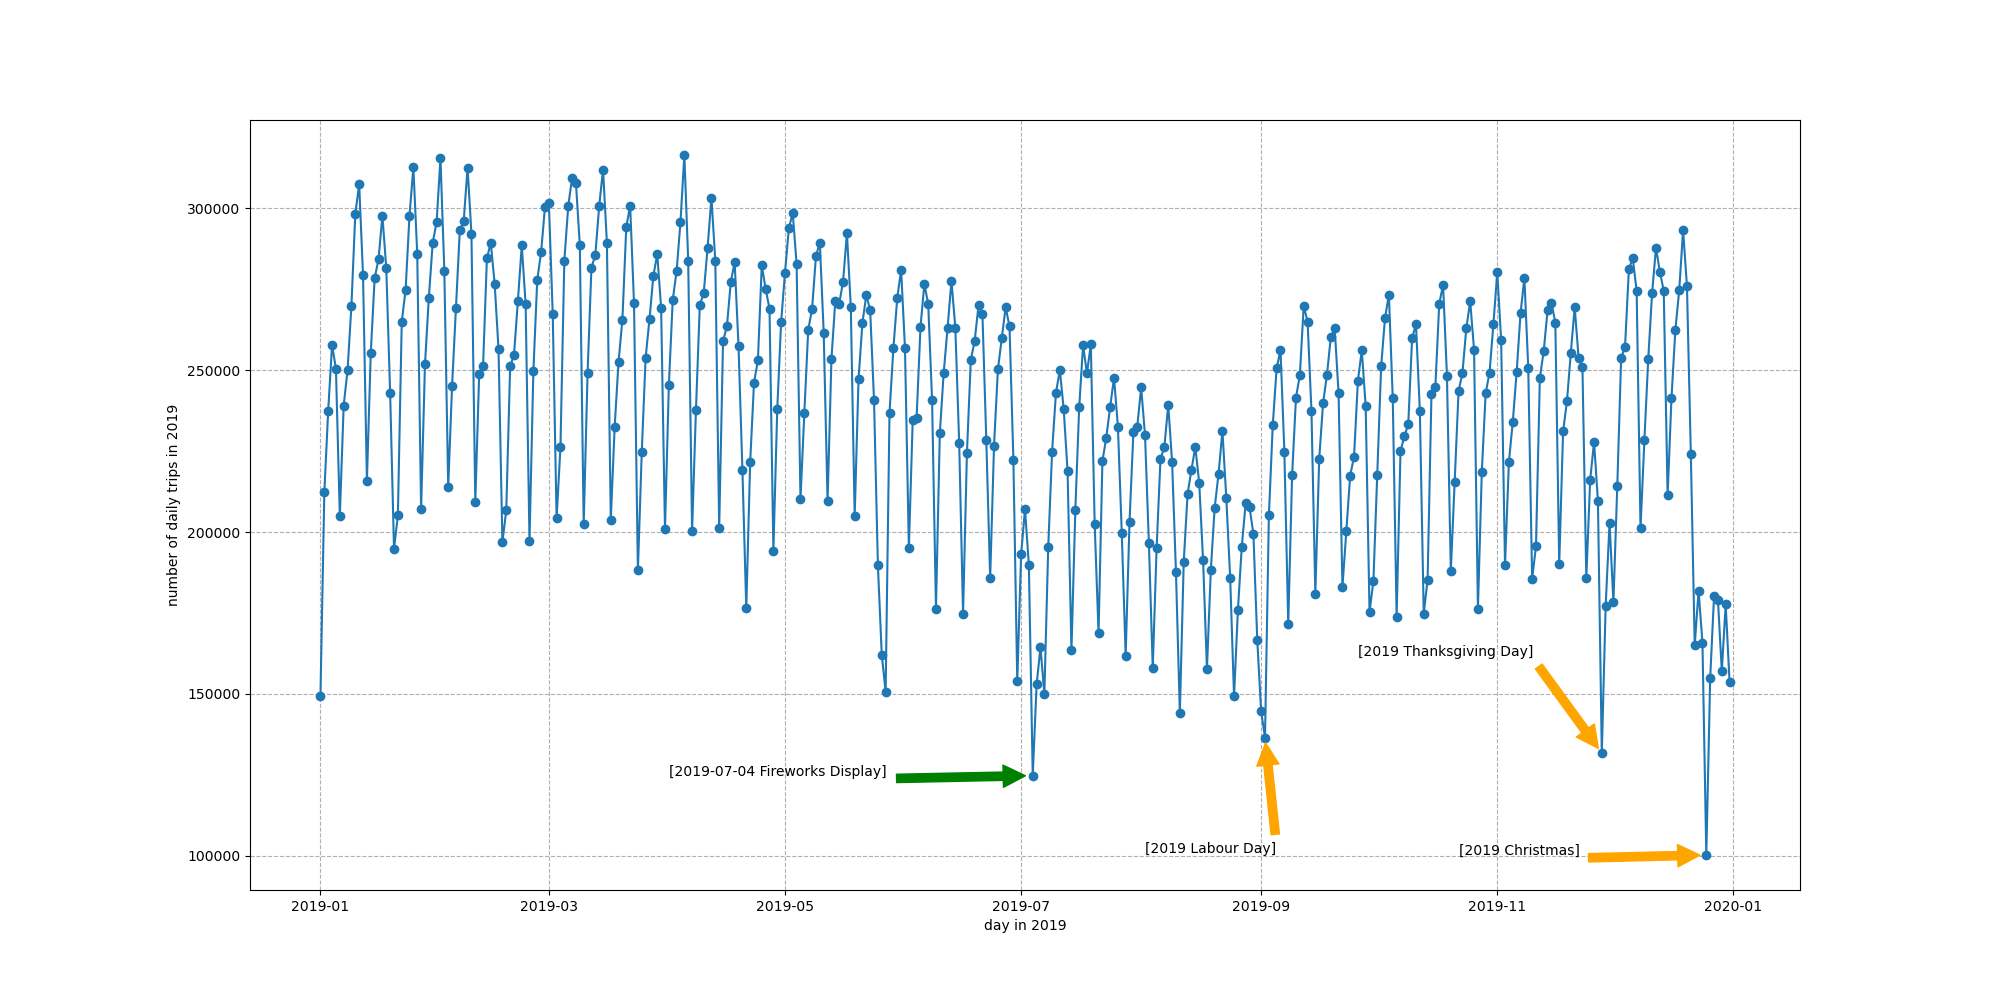
The graphs show an abnormally low number of daily taxi orders for holidays each year, such as Christmas 2017, Christmas 2018, Labor Day 2019, Thanksgiving 2019, and Christmas 2019. These holidays have been marked with orange arrows in the graphs. This indicates that the whole family will celebrate the holidays together at home instead of taking a cab out for fun.
-
In addition, on July 4, 2019, a large-scale firework show took place in New York City, and the number of orders on this day was the second lowest in all of 2019, as marked by the green arrow in the graph. This indicates that New Yorkers viewing the show will choose other transportation options, such as private car rides for the whole family. Firework Show on 2019-07-04
-
-
During the year 2020, the graph shows that the date of March 11 is the turning point because it is on this date that the World Health Organization declared a global COVID–19 pandemic. After March 11, the number of orders dropped dramatically. Starting March 16, New York City schools were closed. On March 20, the New York State governor’s office issued an executive order closing “non-essential” businesses. Since then, the number of taxi orders in New York City has been meager. COVID-19 pandemic in New York City
-
The observation of these five graphs shows that the number of orders fluctuates regularly with the date shift (disregarding the outliers). Therefore, it is assumed that the number of orders may be related to the day of the week.
-
-
Conclusion:
- Demand for taxi rides from New Yorkers will plummet on snowstorm days, holidays, or days with big-scale celebrations.
- The covid-19 pandemic has enormously impacted the taxi industry in New York City.
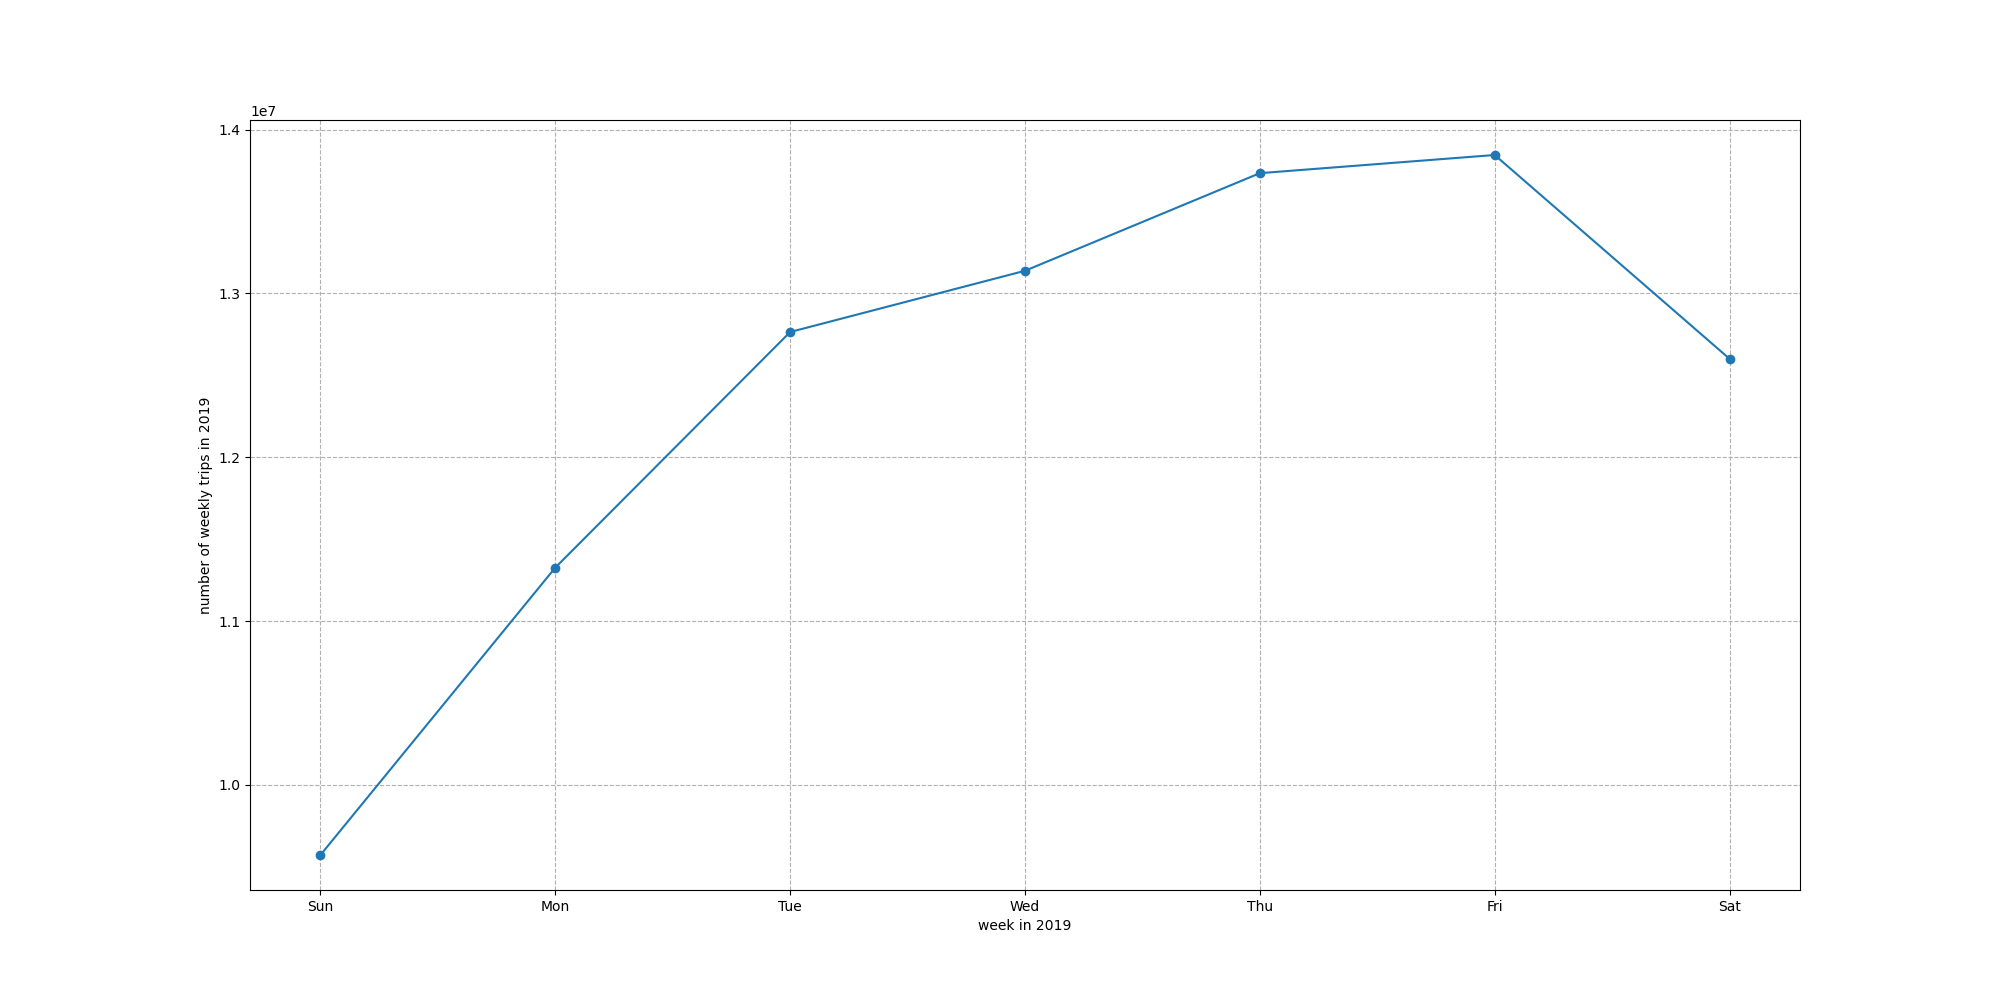
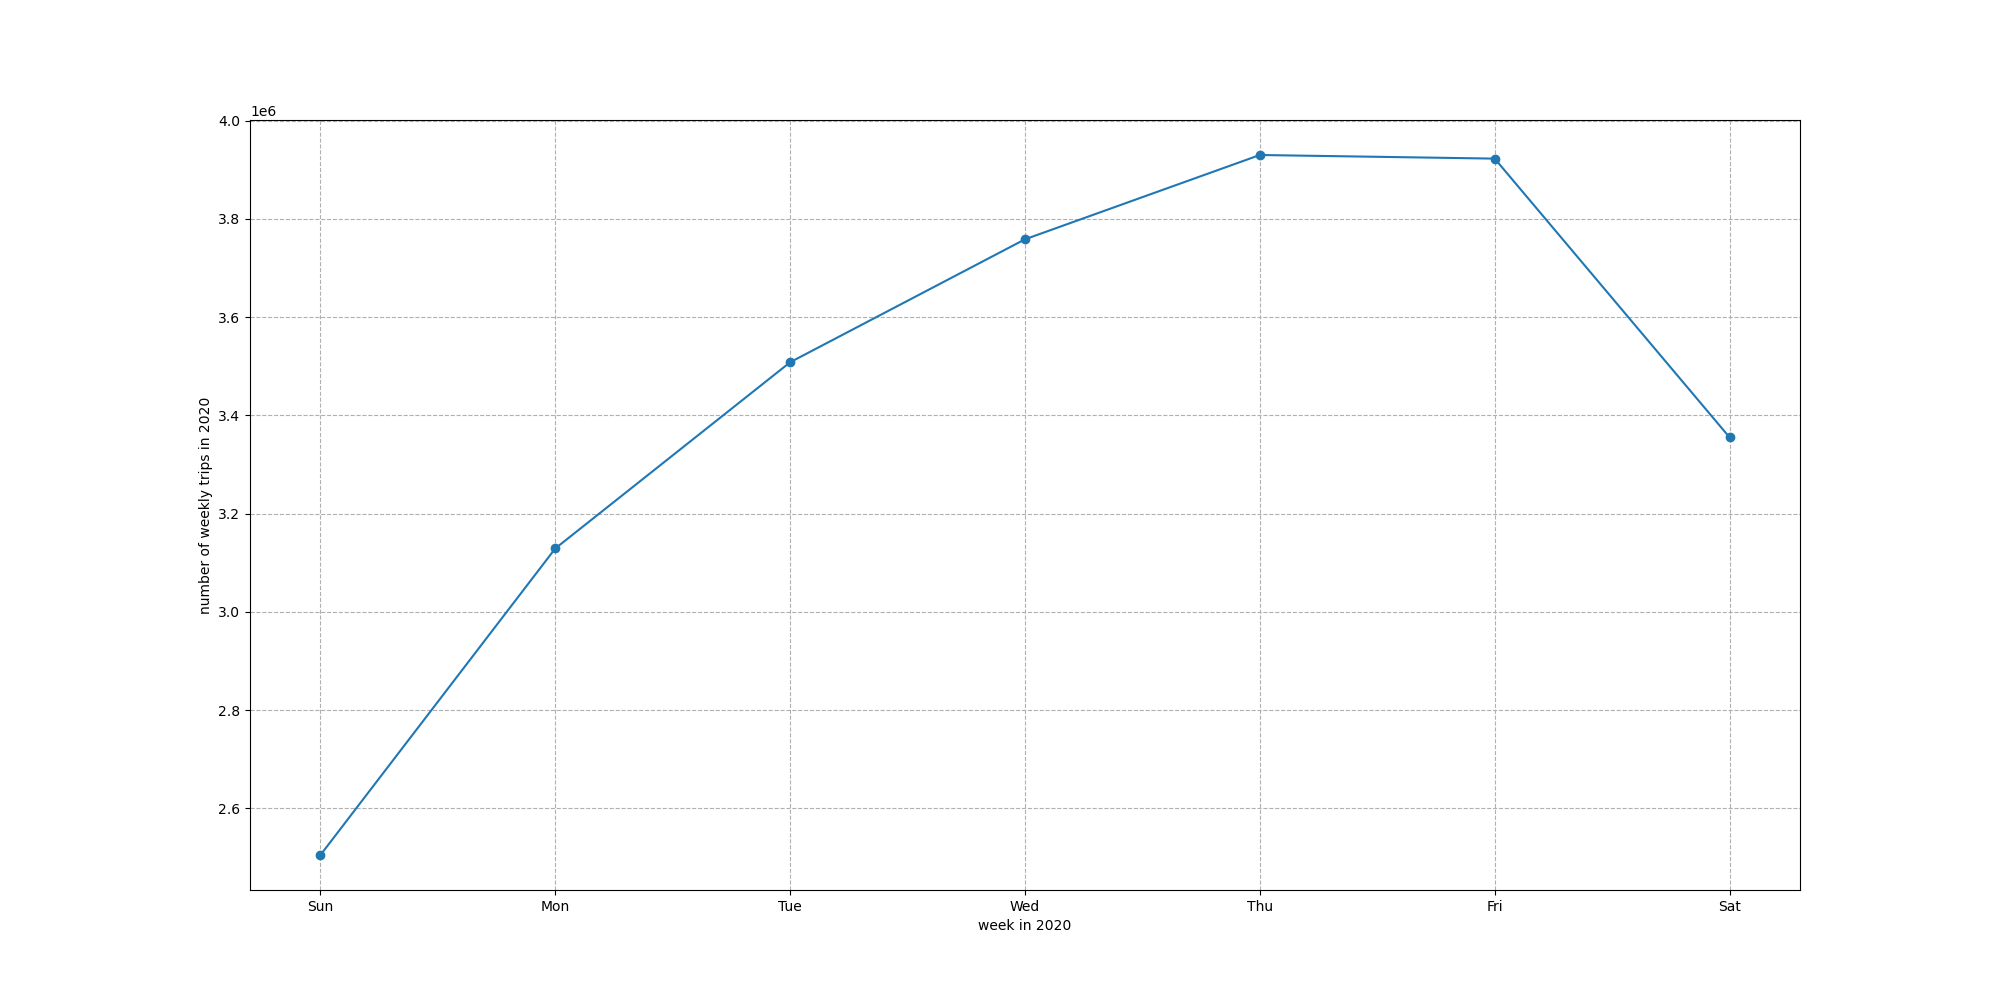
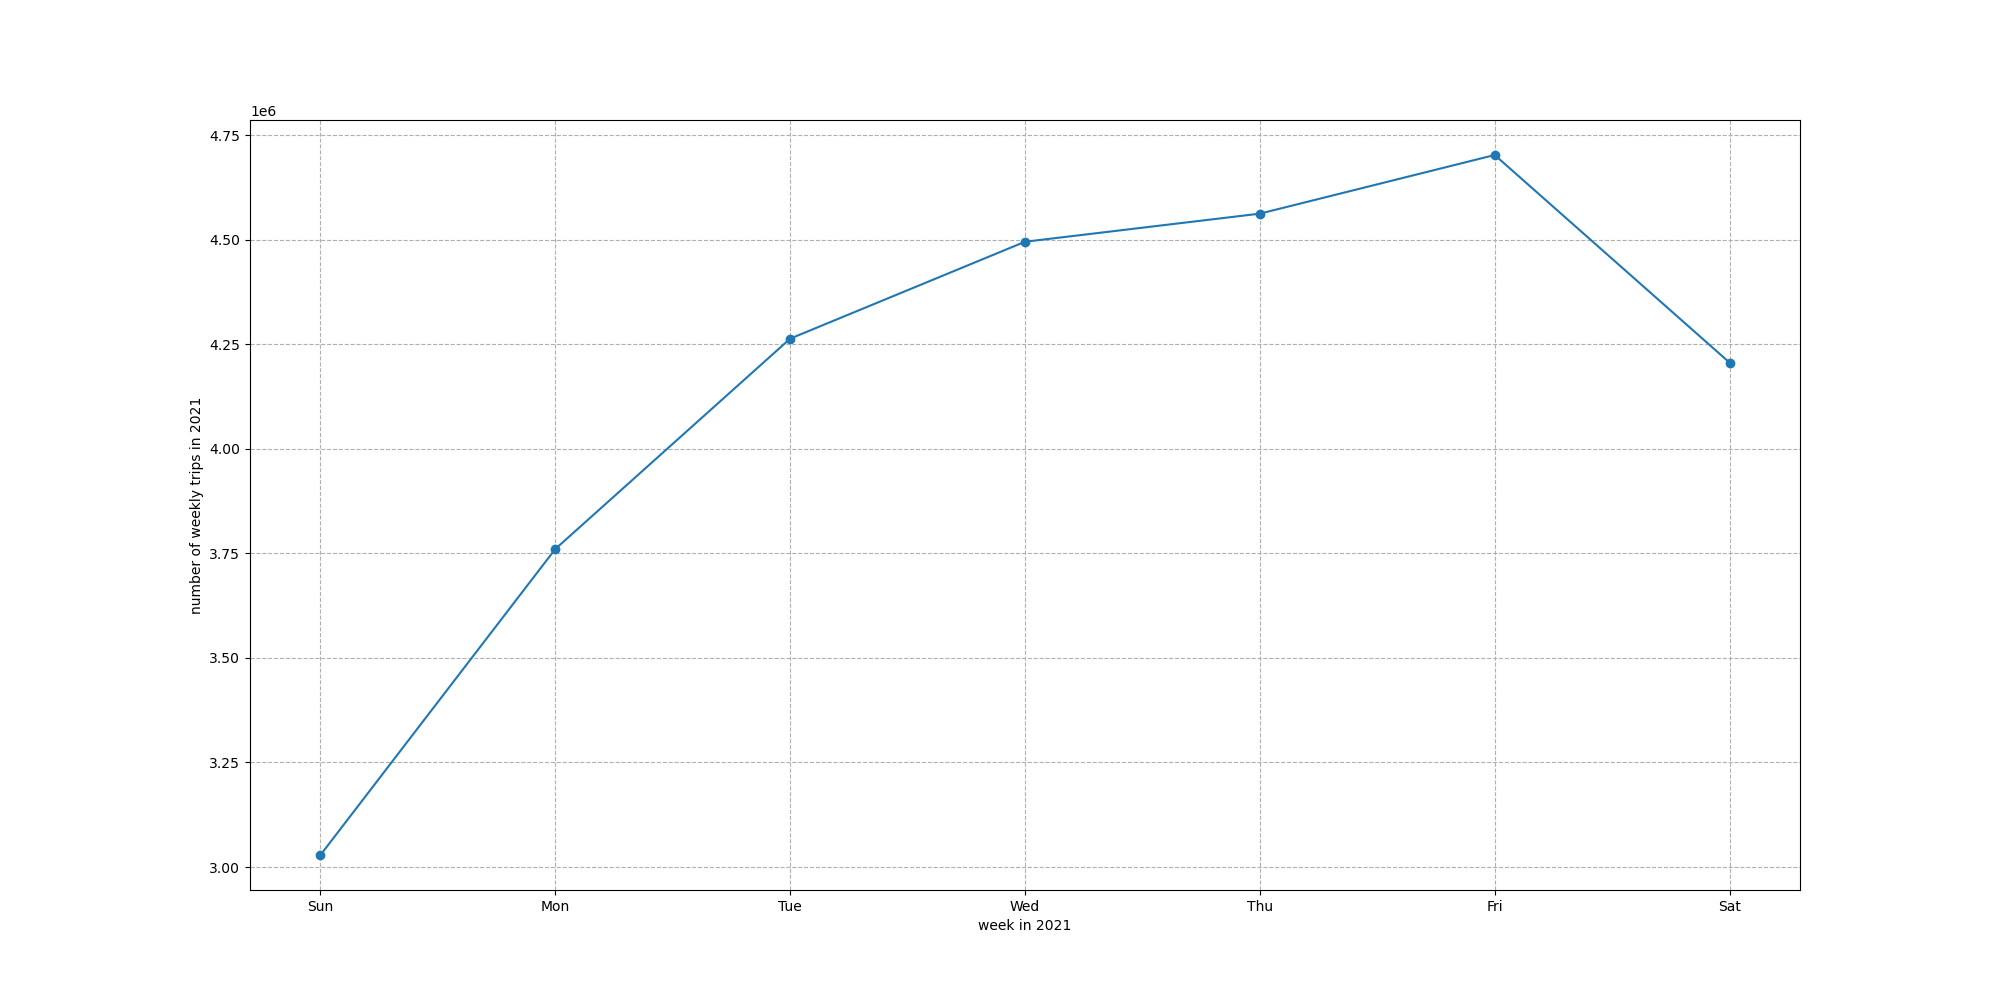
Weekday order numbers and Average passenger numbers in 2017-2021
weekday order numbers:
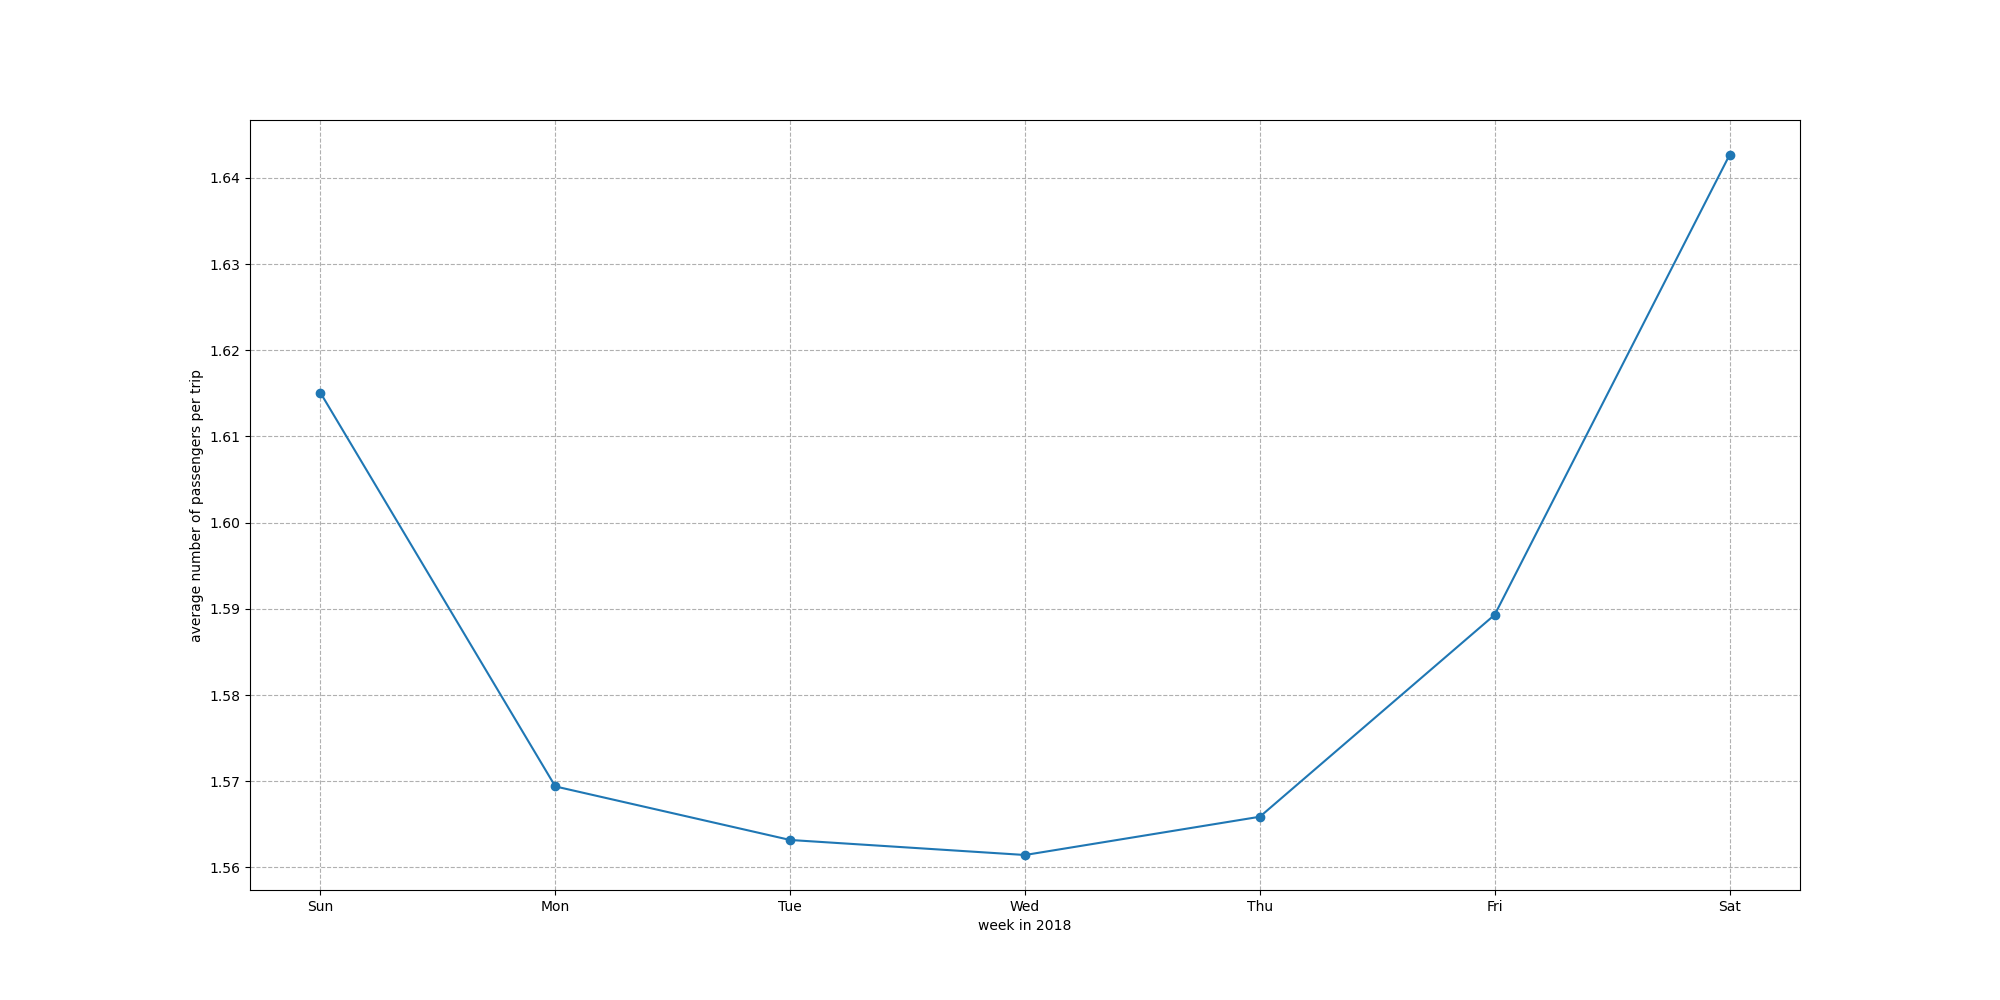
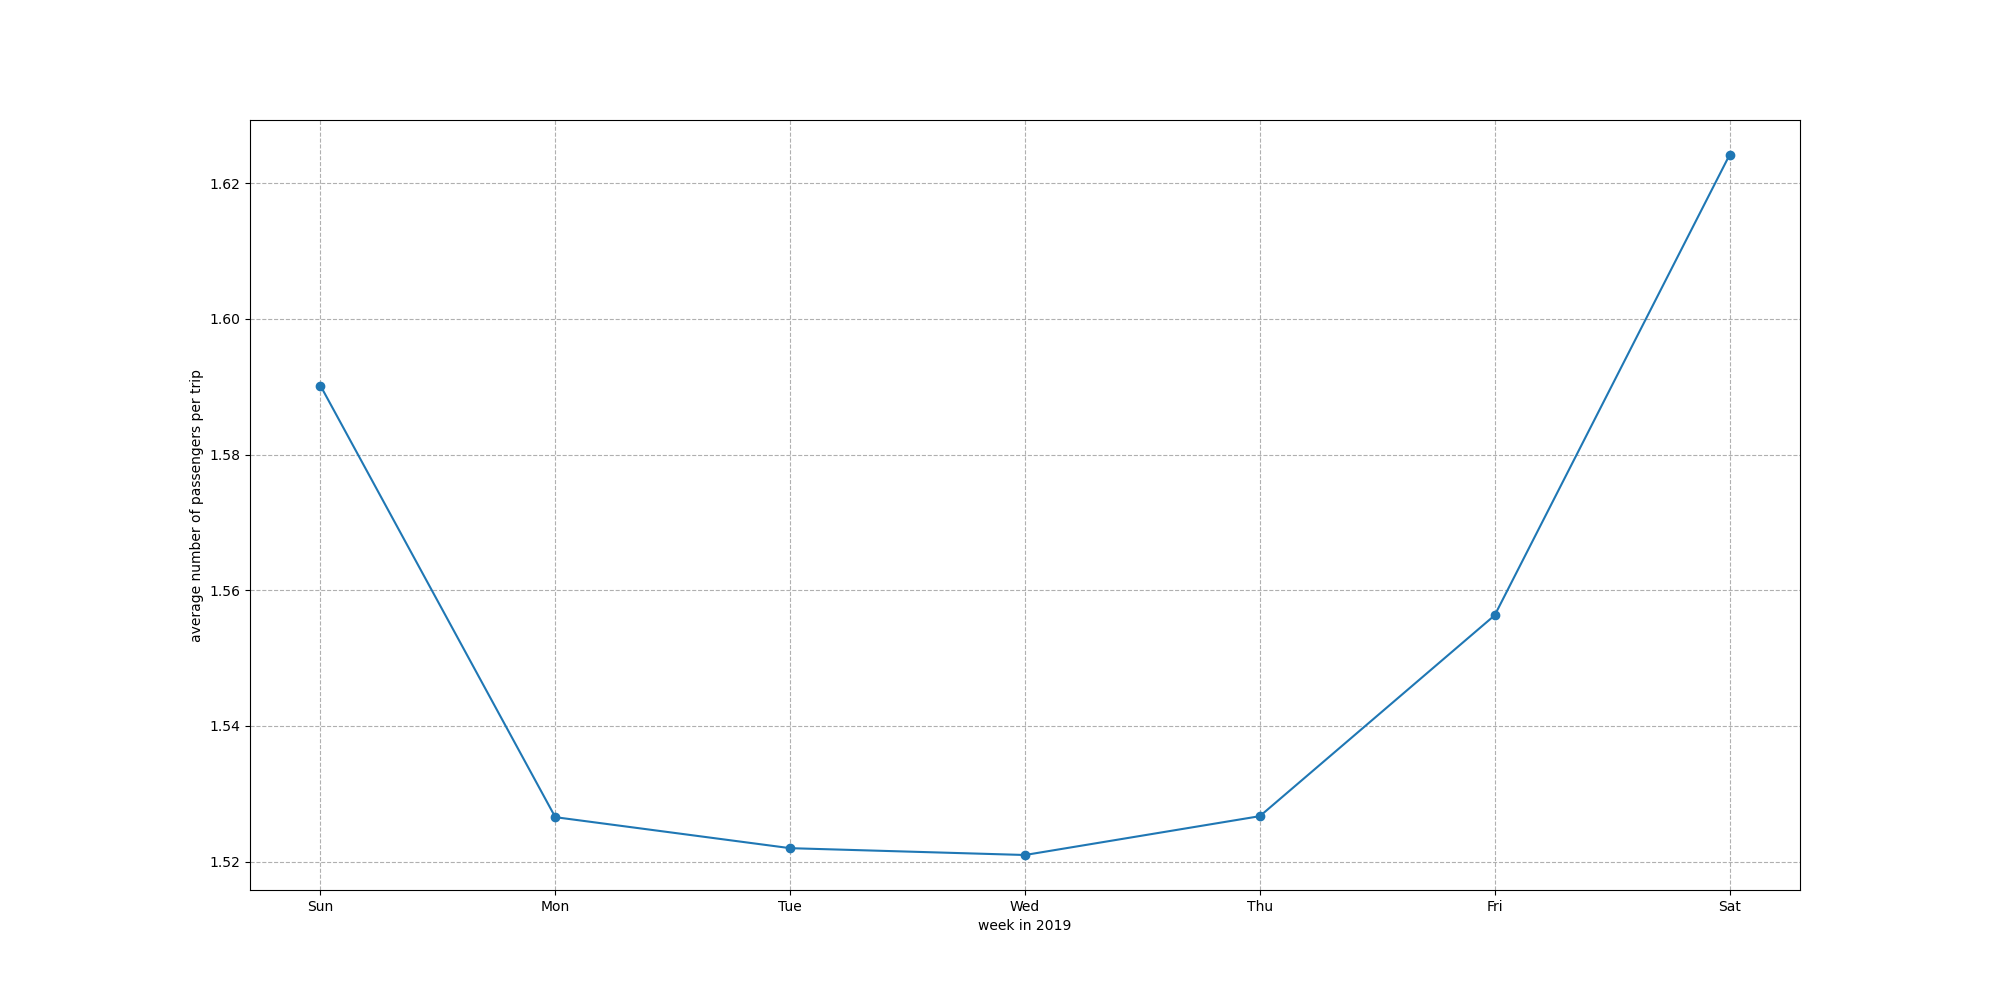
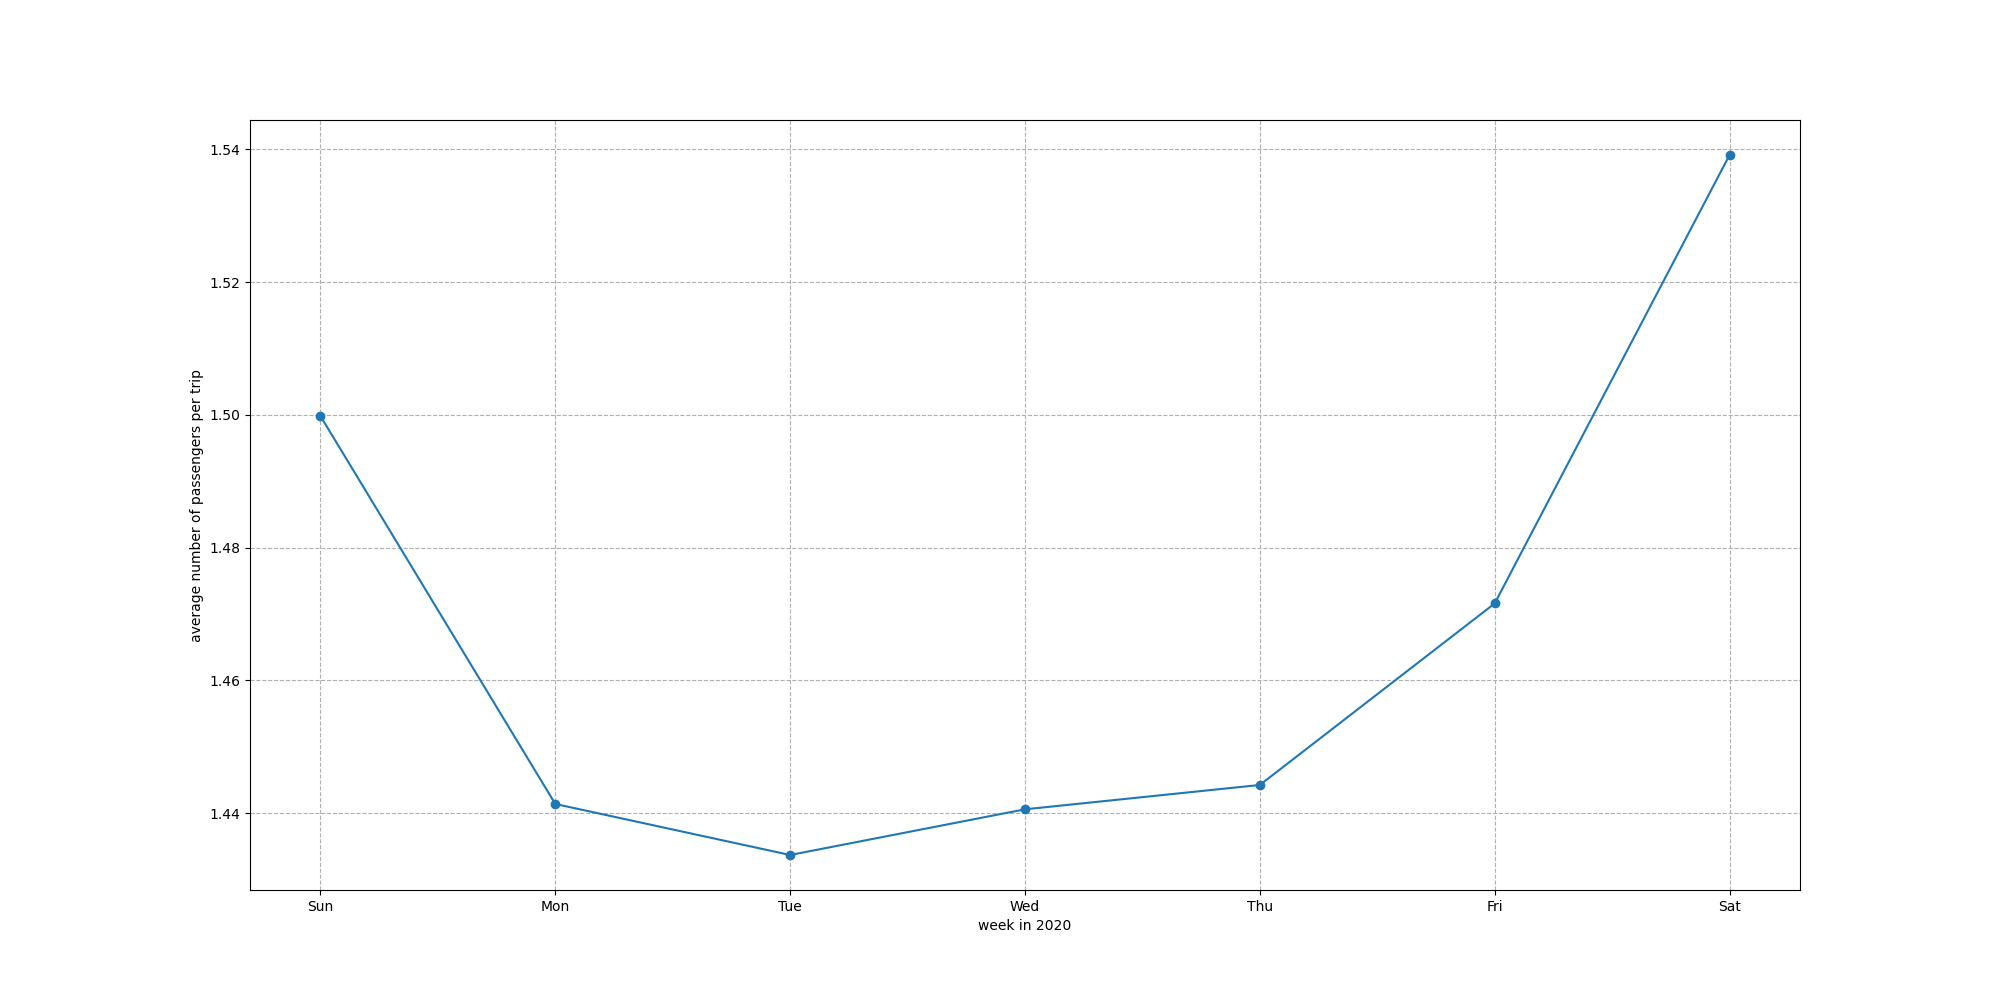
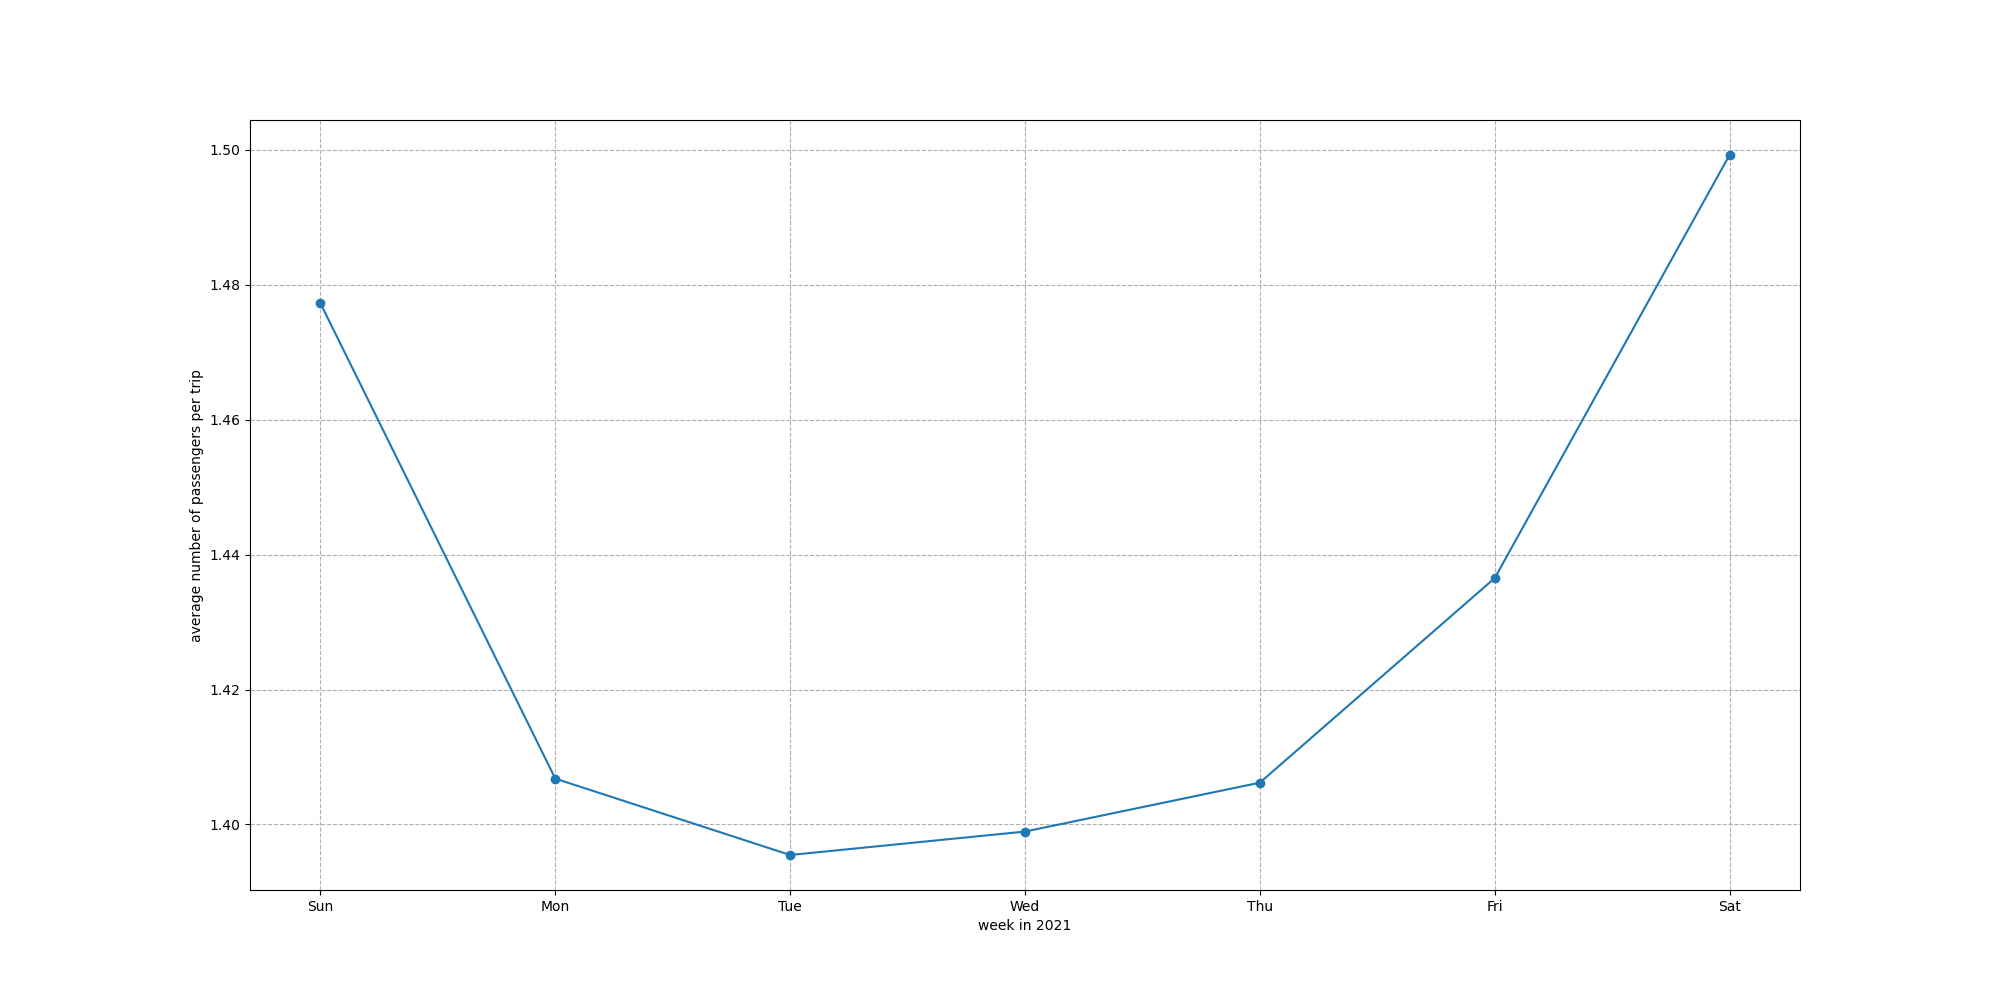
average passenger numbers per order:

-
Question: How does the number of taxi orders vary in a week? How does the average number of passengers per order vary in a week?
-
Analysis: From the ten graphs above, the trend in the number of taxi orders is consistent, as well as the trend in the average number of passengers per order.
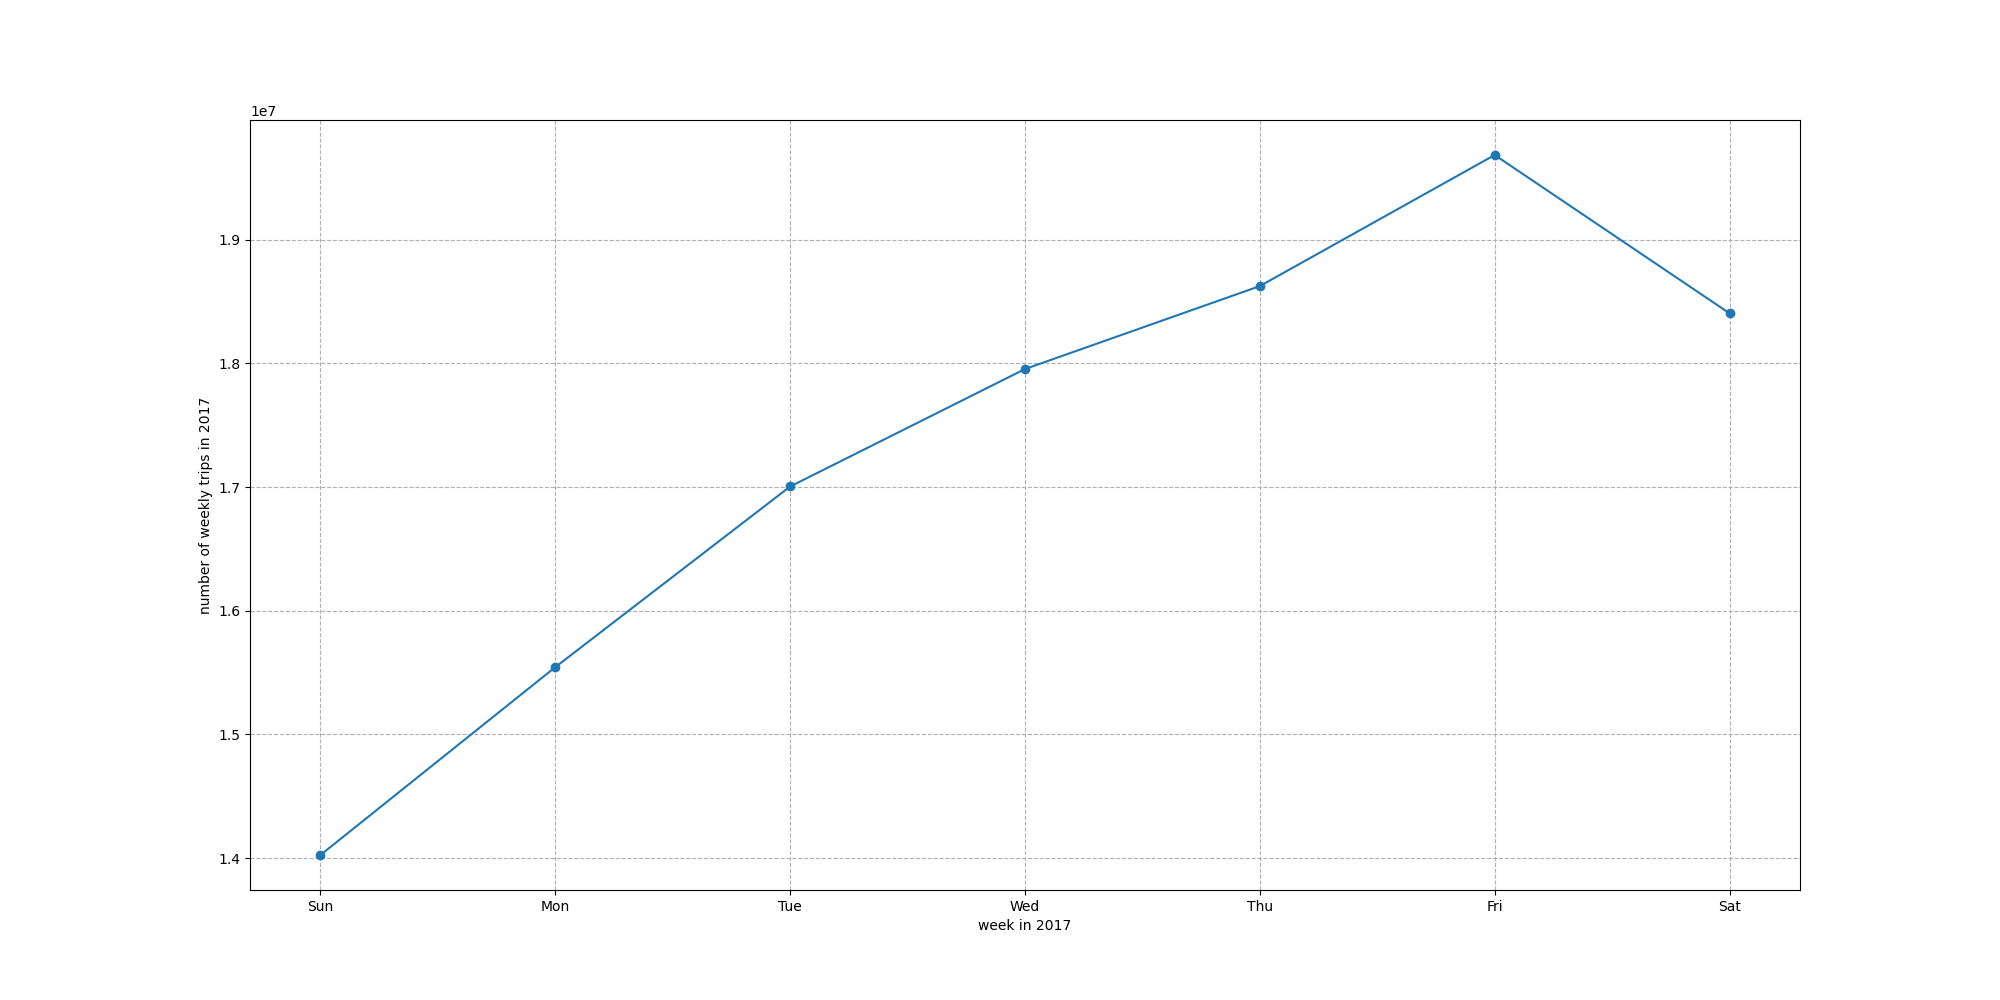
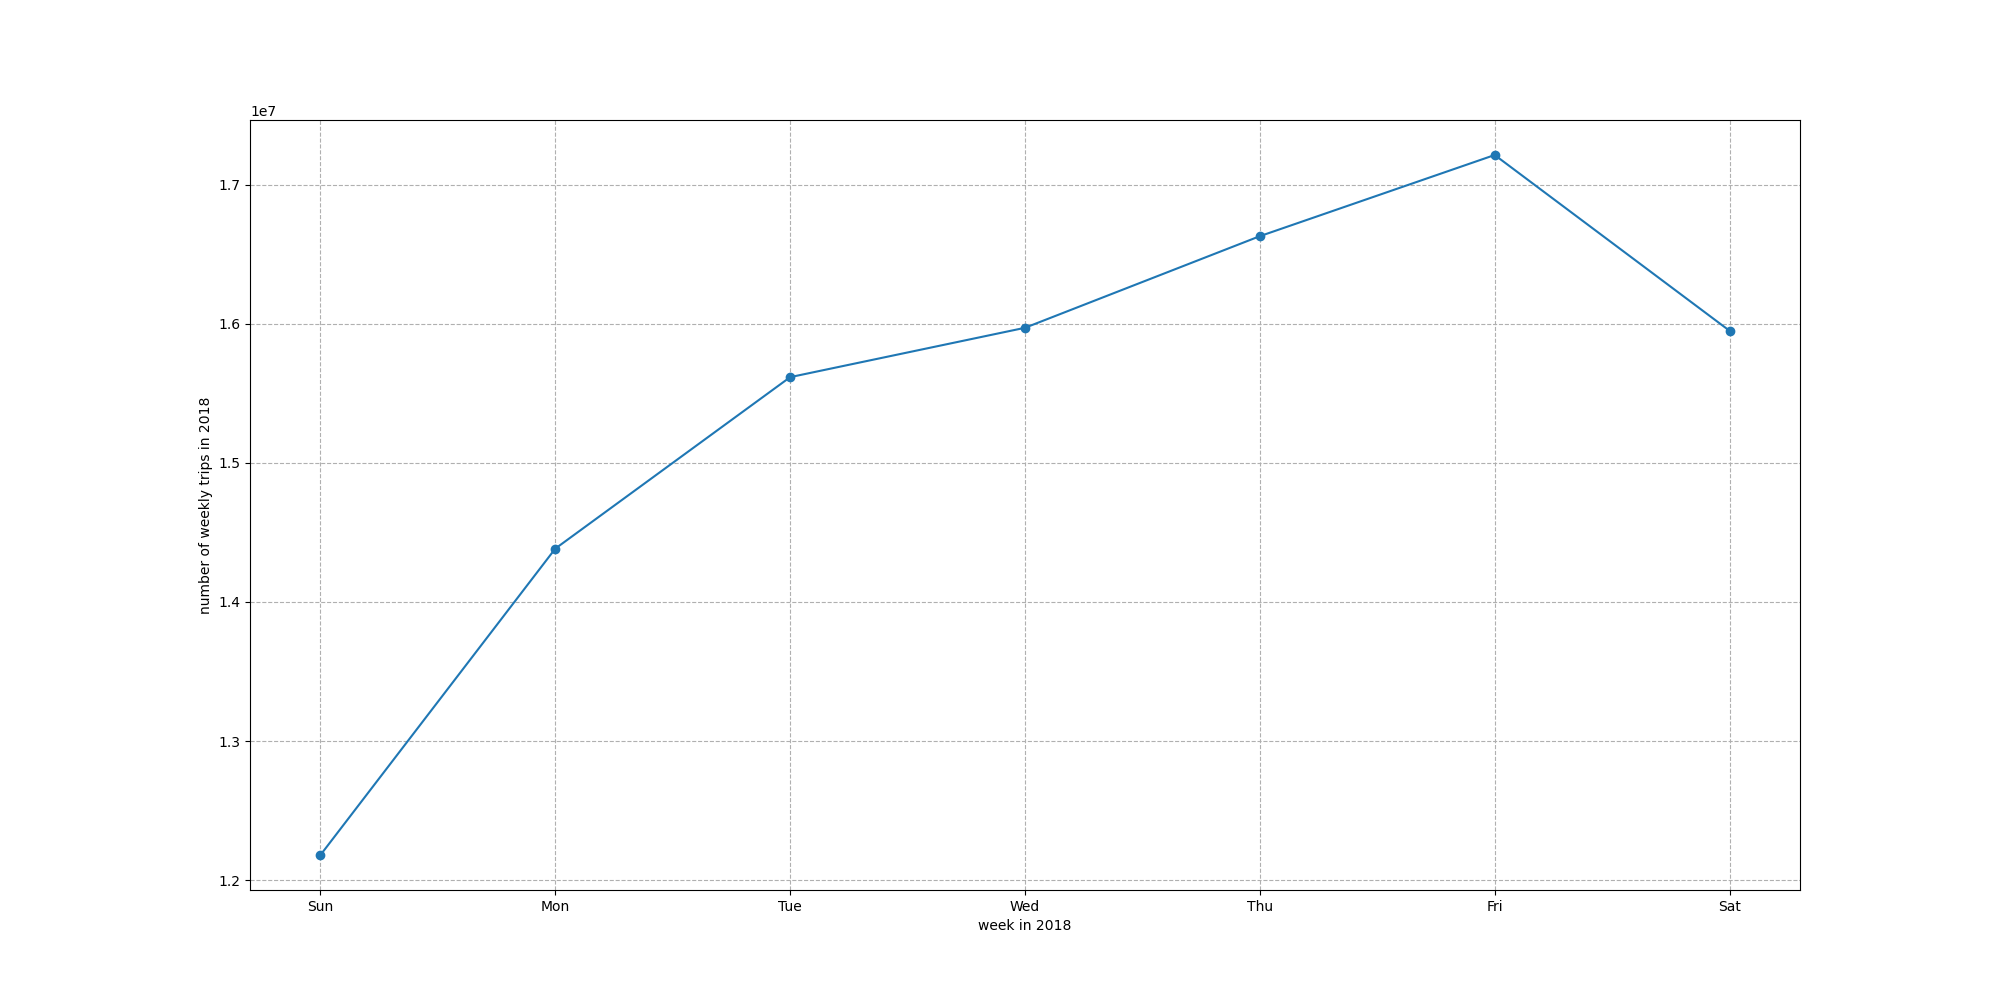
- The number of orders increases linearly from Sunday to Friday, falling back to the same level as Tuesday on Saturday, which indicates that people take taxi trips most frequently on Thursday and Friday. The result could come from two reasons: one could be that New Yorkers are more willing to go out on Thursday and Friday, and the second could be that New Yorkers are more willing to choose to take a taxi on Thursday and Friday.
- The trend of the change of the single average number of passengers from Monday to Sunday shows that Saturday and Sunday are the high periods of multi-person carpooling, which is reasonably presumed to be due to the higher chance of traveling in a group due to the holiday weekend.
-
Conclusion:
- New Yorkers have the highest demand for taxi rides on Fridays and Thursdays.
- New Yorkers have the lowest demand for taxi rides on Sundays.
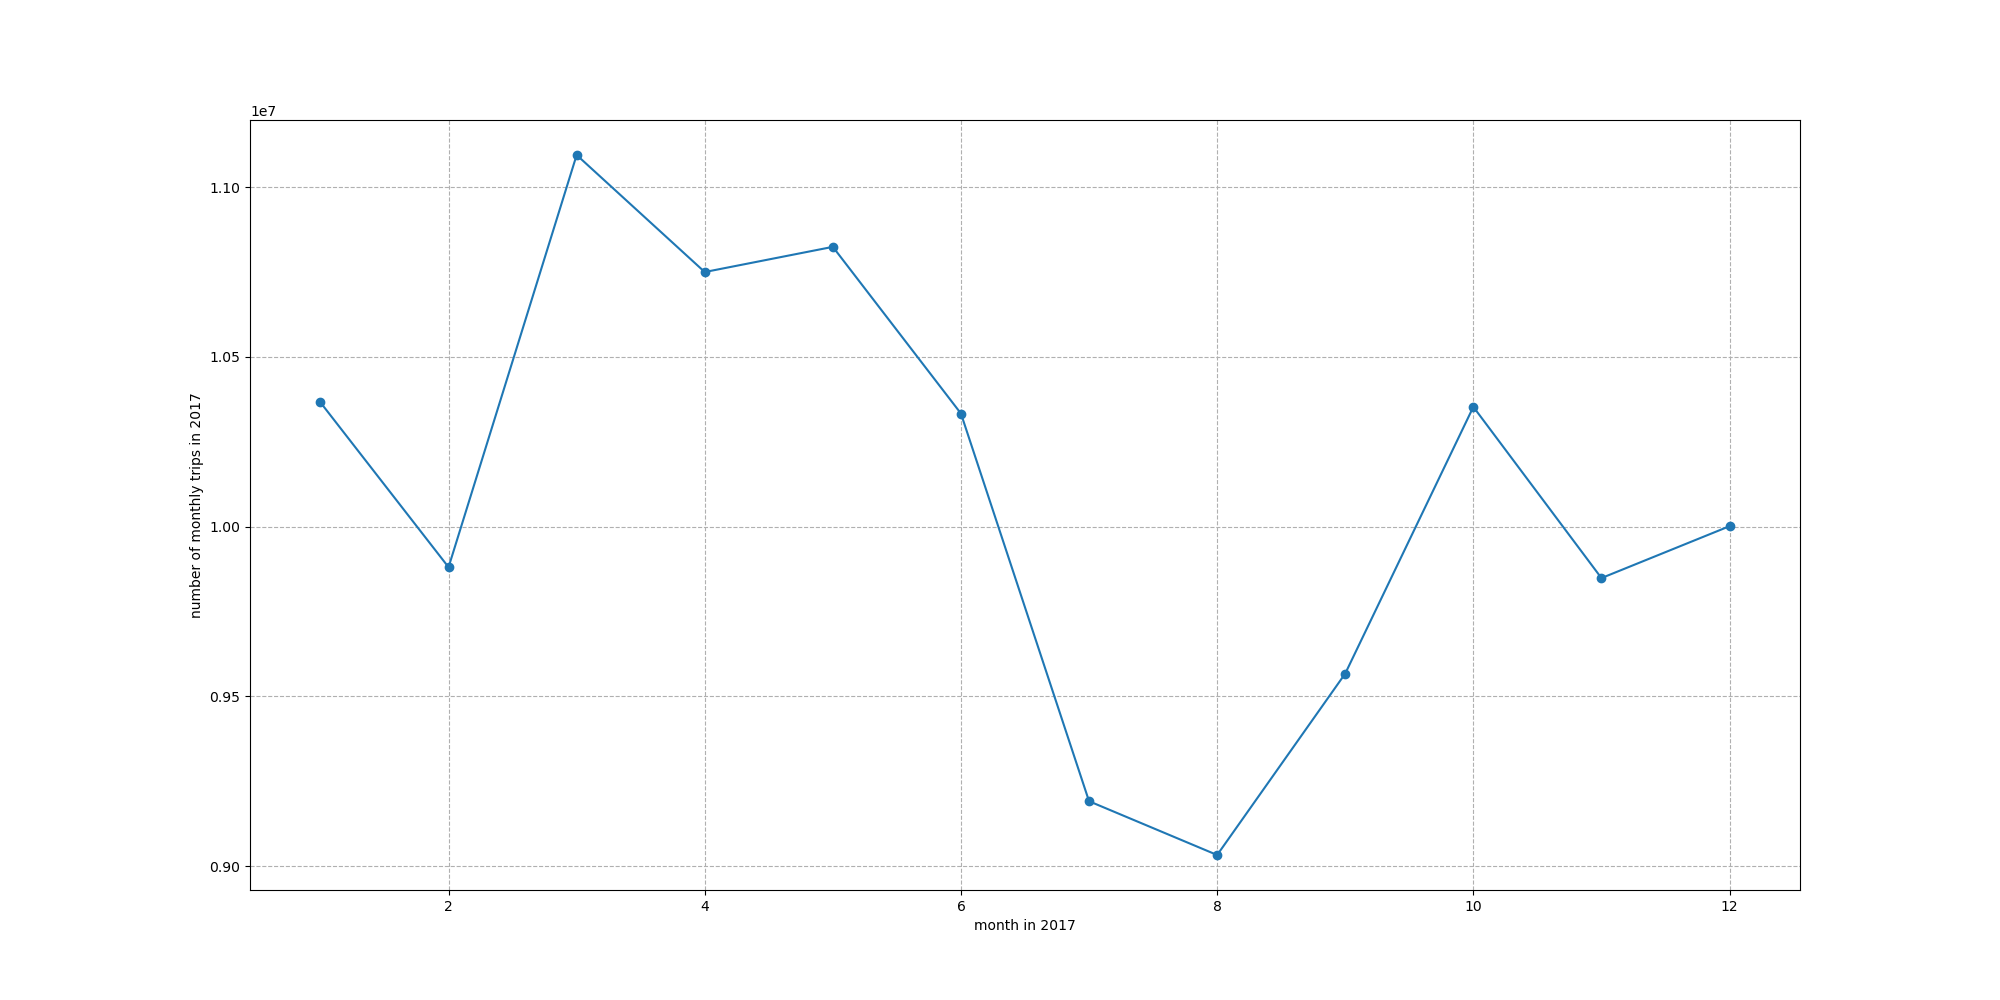
Monthly order numbers in 2017-2021
-
Question: How does the number of taxi orders vary by month?
-
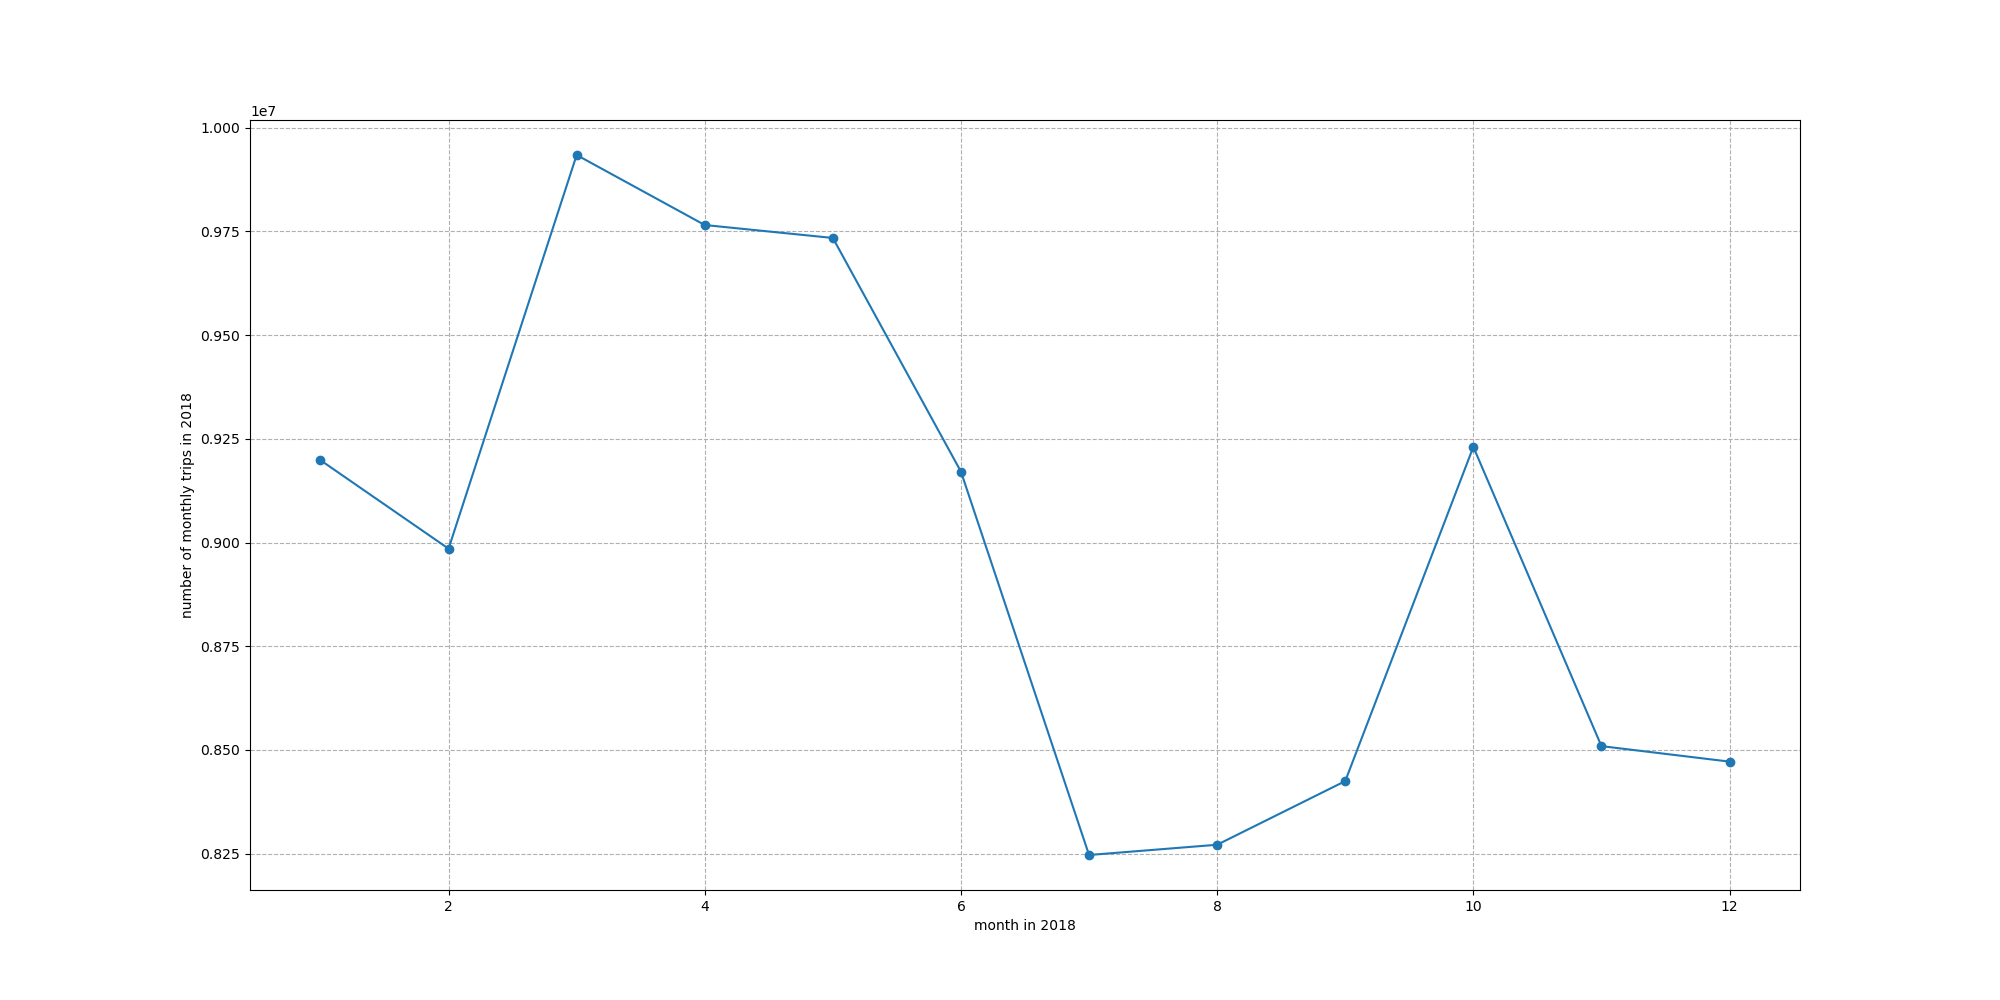
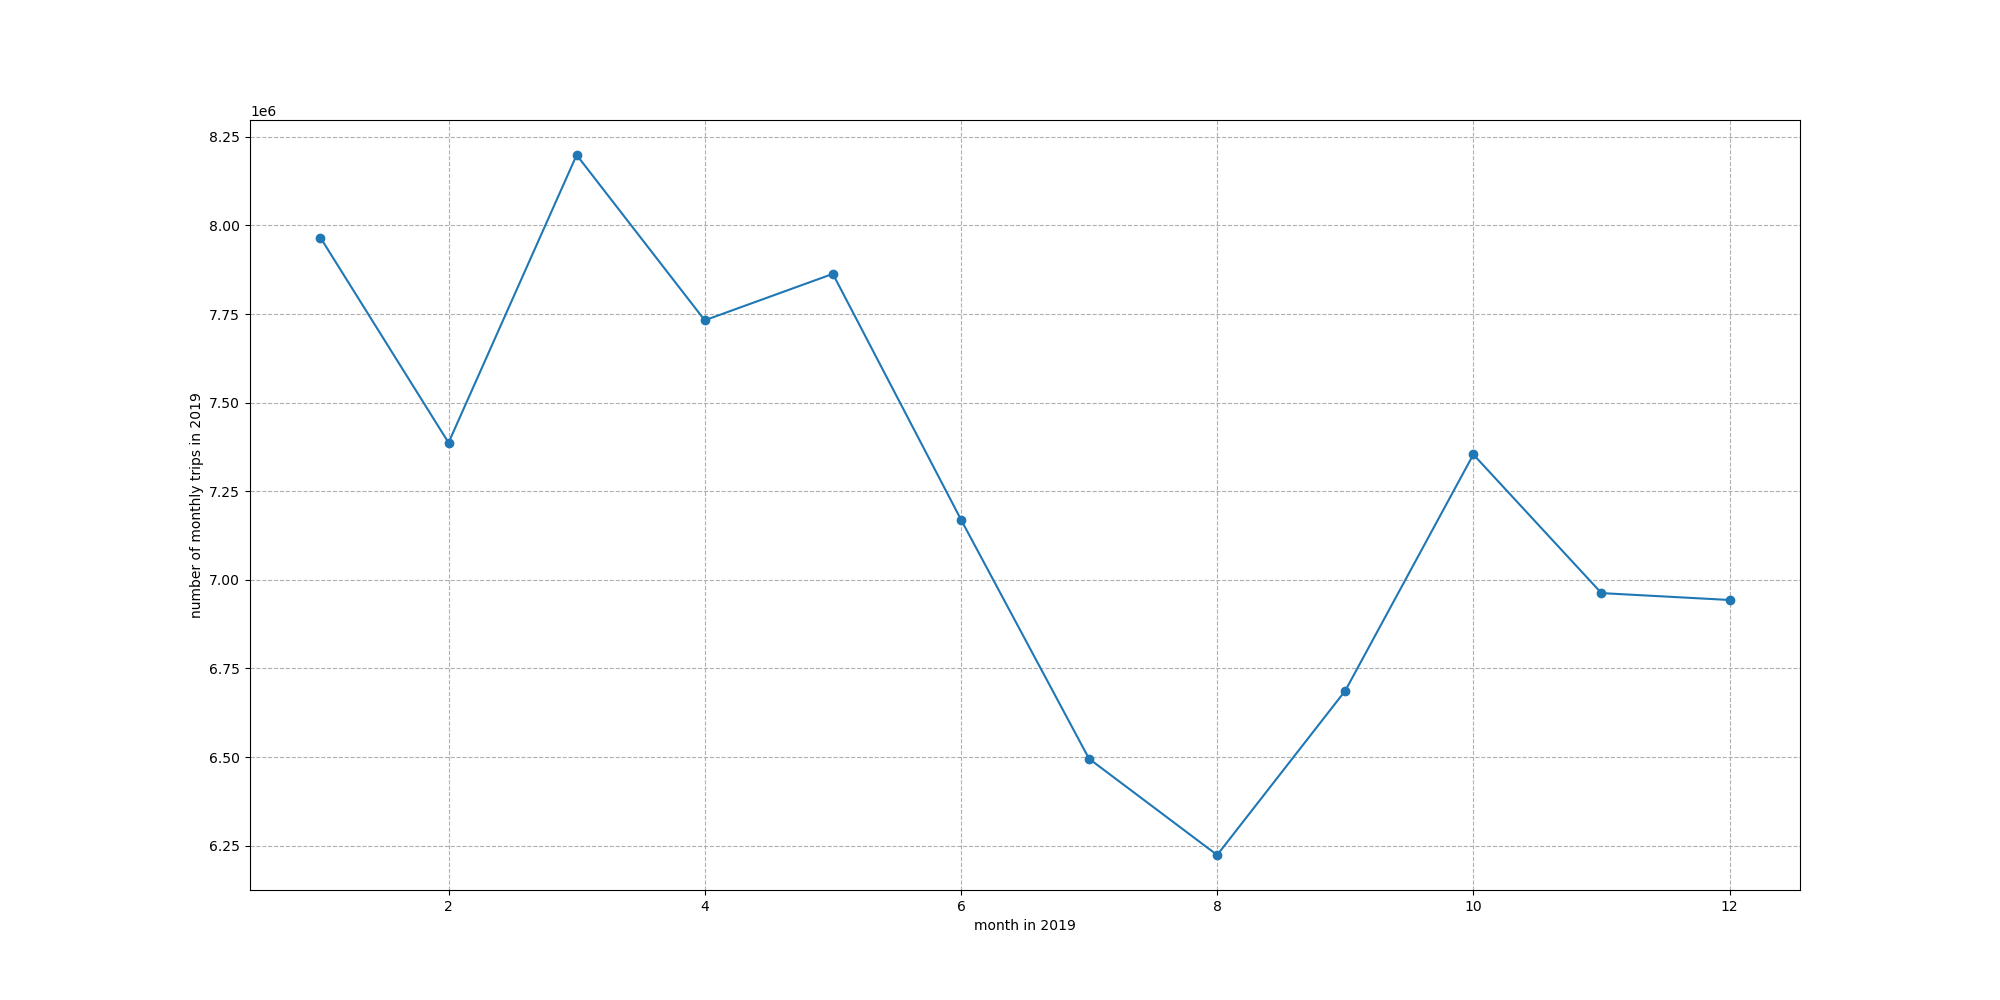
Analysis: From the first three graphs above, we can see that before the Covid-19 pandemic, the number of monthly orders was relatively consistent. However, during the pandemic, everything has changed.
-
From 2017 to 2019, the number of orders increased sharply from February and peaked in March, indicating that New Yorkers are more willing to go outside when Spring comes. Moreover, the number of orders hit rock bottom in August, which may result from relatively hot weather. Also, maybe due to the cooler climate, New Yorkers are more willing to travel, and the number of orders reached a small peak in October.
-
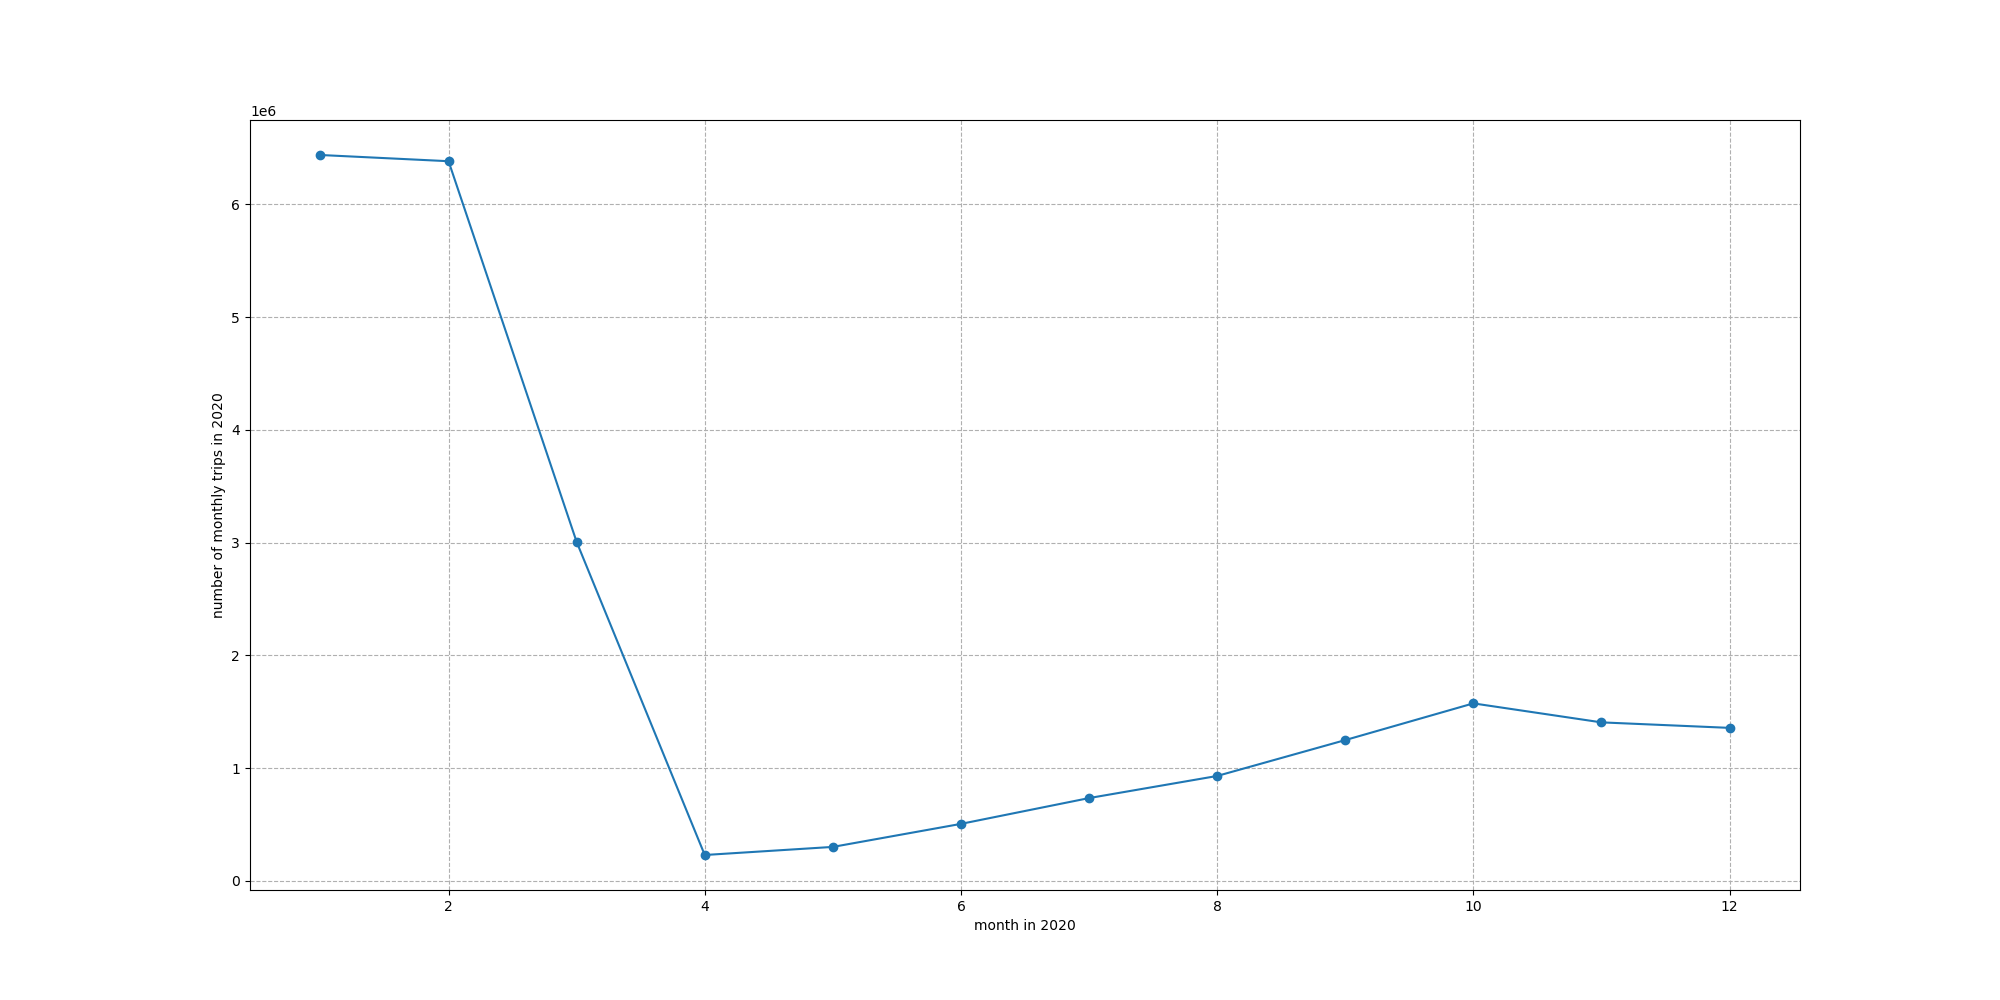
In 2020, due to the outbreak of the Covid-19 pandemic, the number of orders fell off a cliff in February 2020, bottomed out in April, and then slowly rebounded.
-
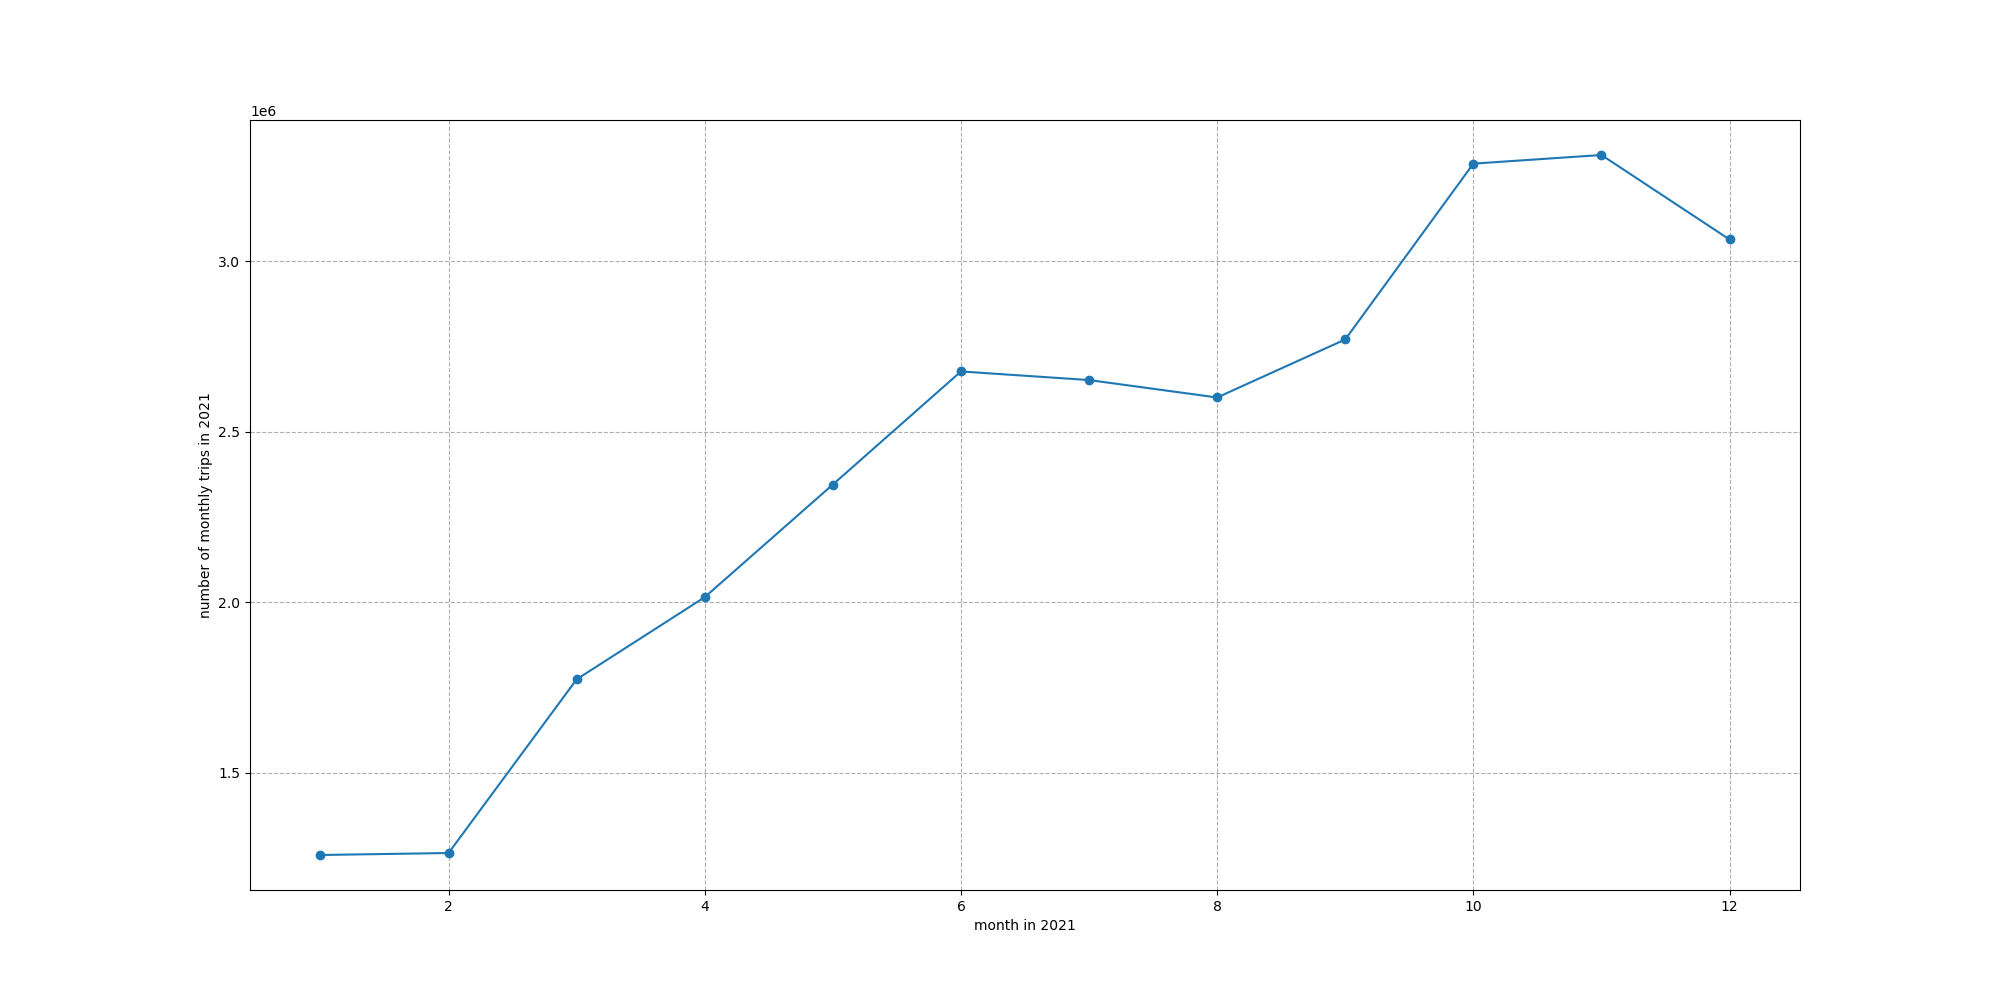
In 2021, as vaccines emerged and the Covid-19 pandemic moved toward an end, New Yorkers were more willing to go out, and orders picked up to a greater extent than in 2020.
-
-
Conclusion:
- New Yorkers have the highest demand for taxi rides in March.
- New Yorkers have the lowest demand for taxi rides in August.
- The covid-19 pandemic has enormously impacted the taxi industry in New York City.
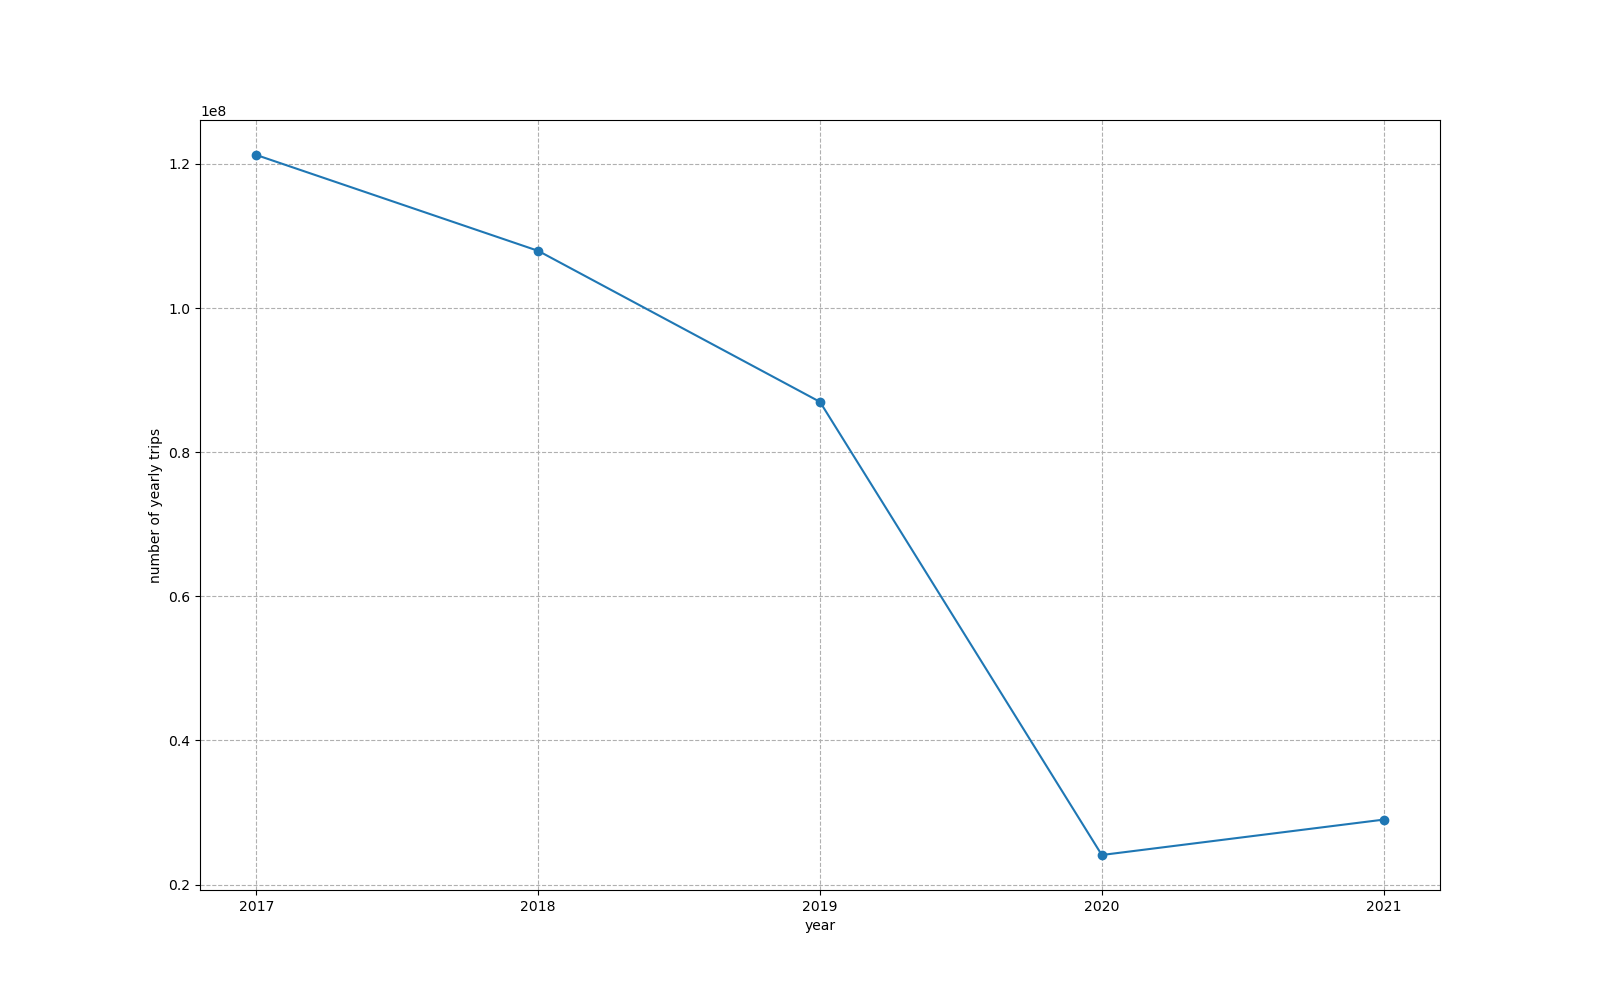
Annual order numbers in 2017-2021
-
Question: How does the number of taxi orders vary by year?
-
Analysis: By counting the total number of orders from 2017 to 2021, a surprising fact was found that there were 12124634 orders in 2017, 10794349 in 2018, 86982175 in 2019, and only 24108787 in 2020, 29018811 in 2021.
-
After plotting the data as a folded line graph, it is easy to see that from 2017 to 2019, the total number of orders decreased yearly. However, the decline was not very significant. Probably, the decline was because the global economy shrinks every year, and New Yorkers chose cheaper public transportation, such as the subway, instead of taxis for travel in order to save money.
-
In 2020, due to the initial outbreak of the Covid-19 pandemic, the lives of New Yorkers were significantly affected, and the total number of taxi orders dropped quite dramatically to about a quarter of what it was in 2019. The decline may be related to the fact that new Yorkers responded to the government’s call to work and study at home and minimize non-essential travel. In addition, because of the economic impact of the new crown, citizens may have even less money to spare and are increasingly less likely to choose taxi travel.
-
In 2021, as the impact of the Covid-19 epidemic shrunk, people gradually returned to going out. As a result, the total number of orders rebounded slightly but still less than 35 percent of the pre-pandemic 2019 level.
-
The same trend can be seen in the heat map above.
-
-
Conclusion: The covid-19 pandemic has enormously impacted the taxi industry in New York City.